“In this complex and multidimensional data environment, the role of visualization will be key in providing the capacity to recognize the emergent patterns and processes of these [natural] phenomena. Visualization will itself become organic, as it will need to adapt to simulate information from a wide spectrum of sources, ranging from micro/organic to macro/planetary states.”[1]
In adopting computational and algorithmic design methods into contemporary design practices, the computer has become a medium capable of translating designers’ logic into computational logic and thereby automating abstractions. Examples of such applications include generative typographic systems and parametric architectural practices, where form is specified by an adaptive and modular range of values in parameters, variables that define themselves by incoming fluxes of data. Computation allows for the automation of rules and real-time generation of forms in response to this data, thereby challenging previously held distinctions between process and product in many cases.
Generated abstractions allow designers to transcend arbitrary social conventions of form. Using models that mimic complex systems leads to the creation of patterns that emerge as a result of naturally occurring processes beyond the influence of culture and society. Generative processes help us understand the world, and remind us that the universe itself is a generative system, ever-changing and kaleidoscopic. It would, therefore, make sense to look unto nature for not just descriptive, but also organizational inspiration.
“In our zealous desire for familiar models of explanation, we risk not noticing the discrepancies between our own predispositions and the range of possibilities inherent in natural phenomena.”[2]
Nature seems to leave behind evidence of its efforts, to which we are witnesses, oblivious to the fact that every pattern is a mere snapshot of much longer operation in motion, one of information exchange.
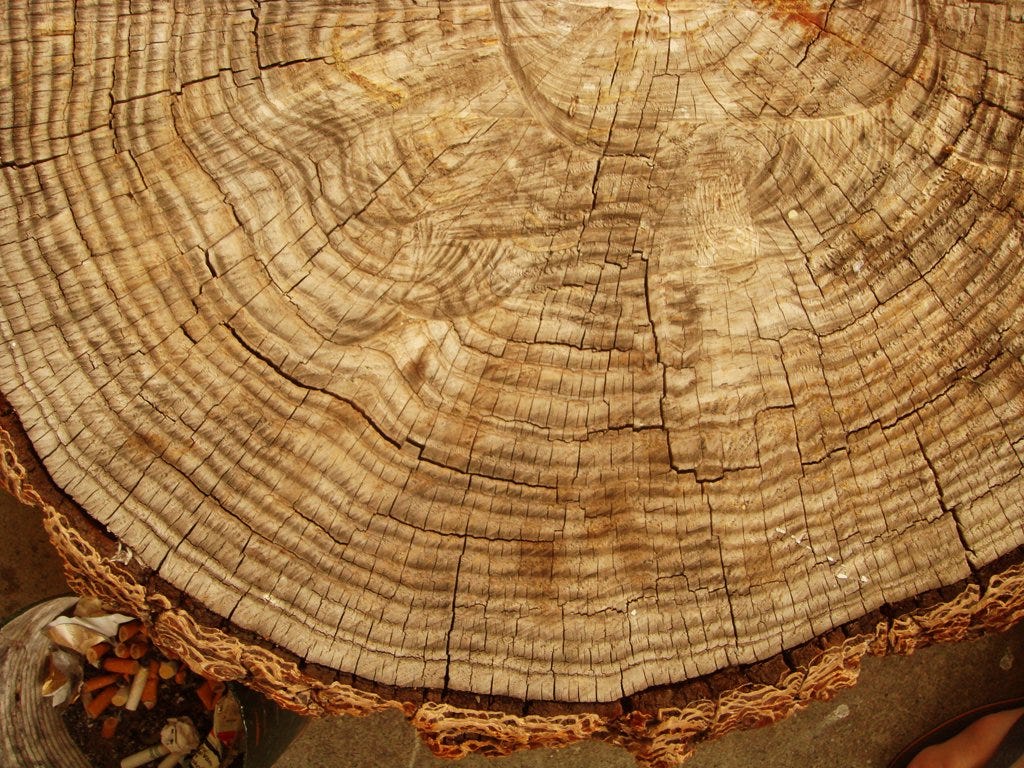
The passage of time is recorded, for example, by trees who gain
a new protective sheath annually. The cross-section of a tree reveals these layers of data in the form of growth rings, which arise due to the change in the speed of growth through the four seasons. Tree rings are more visually pronounced in environments that have a distinct hot and cold season. Typically one ring records the passage of one year in the life of the tree. The width of the ring is directly proportional to how wet the particular year was. Therefore an older tree’s growth rings can tell us about ancient climate, and tree rings from different continents can be compared to infer different climatic conditions. Similar annual growth rings can be seen on certain shells and corals as well.
To an information designer, this dendrochronological (dendron = tree, Chronos = time, logos = the science of) phenomena could be seen as a data visualization because:
1. It communicates a quantitative message visually or experientially i.e. the age of the tree, climatic conditions of the location, etc.
2. It has abstracted information in some schematic form, including attributes or variables for the units of information i.e. the number of rings, the width of the rings, etc.
Nature with its regenerative capabilities seems to possess an intelligence analogous to some generative art and design practices. The role that trees play in this regard is as data-collecting cultural probes, that not only contain but also communicate the imprints left on them, through the complex interactions with their environments.
Similarly, a stack of tomatoes or strawberries for instance, although similar in shape, indicate ripeness through its observable features. They could be placed on a visual spectrum, in this case from hard to soft, or green to red. As a result of their identical shape, the information container is ignored and the content inside comes to focus. Comparing one tomato to another in such a way brings to mind a visualization technique called ‘small multiples’, popularized by Edward Tufte. Small multiples refer to many graphs of the same scale and axes, placed next to each other thus making them easy to compare with one another.
#visual-design #data-visualisation #complexity #nature #information #data analysis