Time is the most precious treasure Data Scientists have and it must be used efficiently. If you frequently prepare a presentation then it means you are consuming your time with busywork. But why should you do something like grunt work if you can automate it?
This is my second article about the automation of time-consuming works. You can find the other one that is about creating a pdf file with python by clicking here.
This article consists of five parts.
1- Getting Started
2- Adding Images
3- Adding Charts
4- Implementation
Now I’ll show you the basics of creating PowerPoint slides with Python.
Getting Started
**python-pptx** is a Python library for creating and updating PowerPoint files. This article is going to be a basic introduction to this package. If you want to learn much more about it, this is the official documentation page that you should check. Now let’s install the package if you don’t have.
pip install python-pptx
I suggest you use the pip install code line because this package depends on Ixml, Pillow and XlsxWriter packages. If you use setup.py installation method you will need to install these dependencies yourself.
It is always easy to explain something with examples. For this purpose, I am going to use official examples in the first place. At the end of the article, I am going to build a basic PowerPoint presentation page by page. Let’s start with the adding slide. To do this first we need to import the pptx package.
from pptx import Presentation
We are going to use **Presentation()** to open or create a presentation. Let’s assign it to a variable.
prs=Presentation()
Now we are ready to build our first slide. This slide will contain a title and a subtitle.
lyt=prs.slide_layouts[0] # choosing a slide layout
slide=prs.slides.add_slide(lyt) # adding a slide
title=slide.shapes.title # assigning a title
subtitle=slide.placeholders[1] # placeholder for subtitle
title.text="Hey,This is a Slide! How exciting!" # title
subtitle.text="Really?" # subtitle
prs.save("slide1.pptx") # saving file
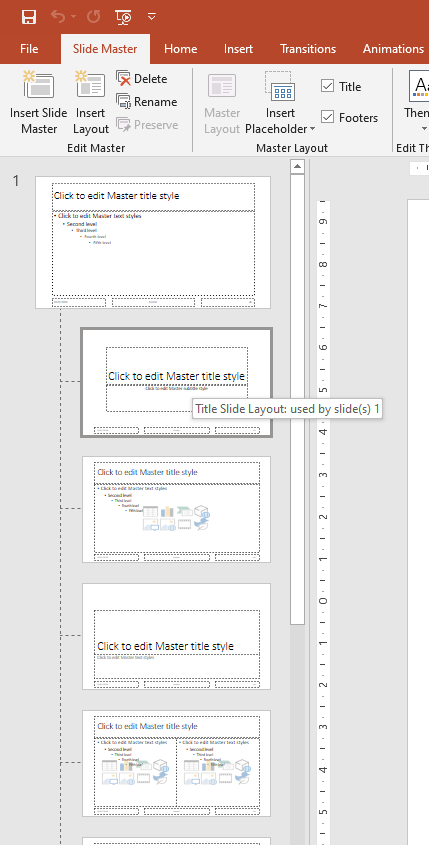
Ok, we’ve just created our first slide. Let’s explain this code block row by row. You can think slide layouts like a template. There are nine slide layouts and we‘ve used the first one for this example. **prs.slide_layouts[0]** This means ‘ I am going to use a title layout’. So how do we know which one should we choose? This is all about Slide Master in PowerPoint. As you see below, the first item on slide master is “Title Slide Layout”. This is why **slide_layouts[0]** gives us the title object. By the way, you can use a blank layout instead of the title layout.
Secondly, we’ve used the add_slide function to add a new slide that inherits the layout. **slide=prs.slides.add_slide(lyt)** By doing this assignment, we’ve just added a slide layout that contains a title object (a big one!).
After this step, we’ve created a title variable. **title=slide.shapes.title**
Next row is **subtitle=slide.placeholders[1]** . This means if you want to add a subtitle then you have to add a placeholder. With **.text** attribute, we can assign a string on a shape.
The last step of our code block is exporting the pptx file. **prs.save(“slide1.pptx”)** saves the slides as pptx in our path. So here is the result;
#presentations #python #data-science #towards-data-science #powerpoint #data analysis