Amazon’s global e-commerce sales are projected to grow by 20% to reach $416.8 billion in 2020, and Amazon ads revenue growth is keeping pace. In 2020, Amazon’s ad revenues in the United States are projected to amount to 12.75 billion U.S. dollars (compare to 10.32 billion U.S. dollars in 2019).
With this increase in activity, one could expect certain improvements in seller’s tools, such as ads analytics, so I decided to use this topic for my data science capstone project at Galvanize bootcamp.
I got access to data from several advertising campaigns of big consumer brands on amazon.com, with a goal to look for potential ways to improve ads ROIs and predict future sales.
The data was stored in 13 tables, which mirror Amazon statistics. More details about the data, as well as the code I wrote you can find at my GitHub page.
Technology I used:
- Prophet time series to forecast potential sales.
- Random Forest Regressor from Sklearn to predict factors affecting sales.
- SHapley Additive exPlanations (SHAP Values) algorithms for the model interpretation.
Keyword performance
My goal was to analyze each keyword performance dynamically, and forecast the future demand.
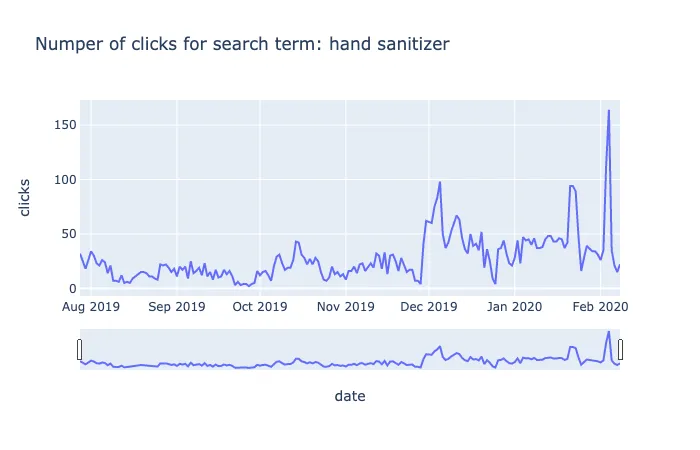
First, I used Plotly library to show the performance for each search term across all campaigns. Below is a ‘hand sanitizer’ example.
#advertising #amazon #data-science #data-visualization