When to use the Network panel
Network tab or panel in Chrome Devtool is one of the most popular debugging tools that software developers especially Web & Front-End developer can use
The most common use cases for the Network panel are
- Making sure that resources are actually being uploaded or downloaded at all
- Inspecting the properties of an individual resource, such as its HTTP headers, content, size, and so on
Intro
I believe that many readers of this article have an experience of using Chrome Devtool at least once. Inspecting the status codes such as 2xx (Success), 4xx Client Error, 5xx Server Error, for example, is one of the common practices software engineers do to see if HTTP request/response is safely delivered to/from the server
There are more features [Network] tab of Chrome DevTools offer and let’s find out some of their features that make your debugging much easier
For a better explanation, I will take screenshots from Chrome DevTools opened from CNBC Youtube video called Do You Need A College Degree To Be Happy?

Tip 1
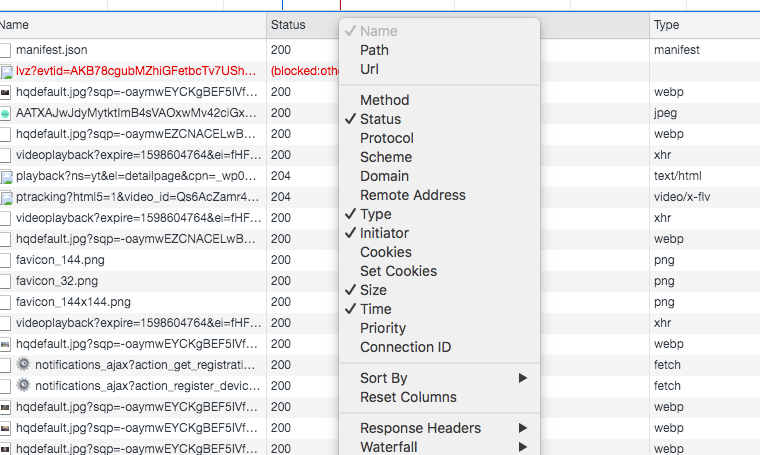
Show more information
There are many columns that are hidden by default which you may find useful. You can right-click the header of the Network Log table and select columns you want to display
#google #front-end-development #web-development #javascript #programming
![7 Tips to use Google Chrome DevTool [Network] tab like an experienced developer](https://miro.medium.com/max/1200/0*89Q9Jzi7XR-g7kn9.png)