Creating a sample app with ReactGrid, Chart.js and Typescript. Learn how to integrate ReactGrid with Chart.js.
ReactGrid is a React.js component for displaying and editing data in a spreadsheet-like way. This guide shows you how to integrate it with the well-known pure Javascript library - Chart.js.
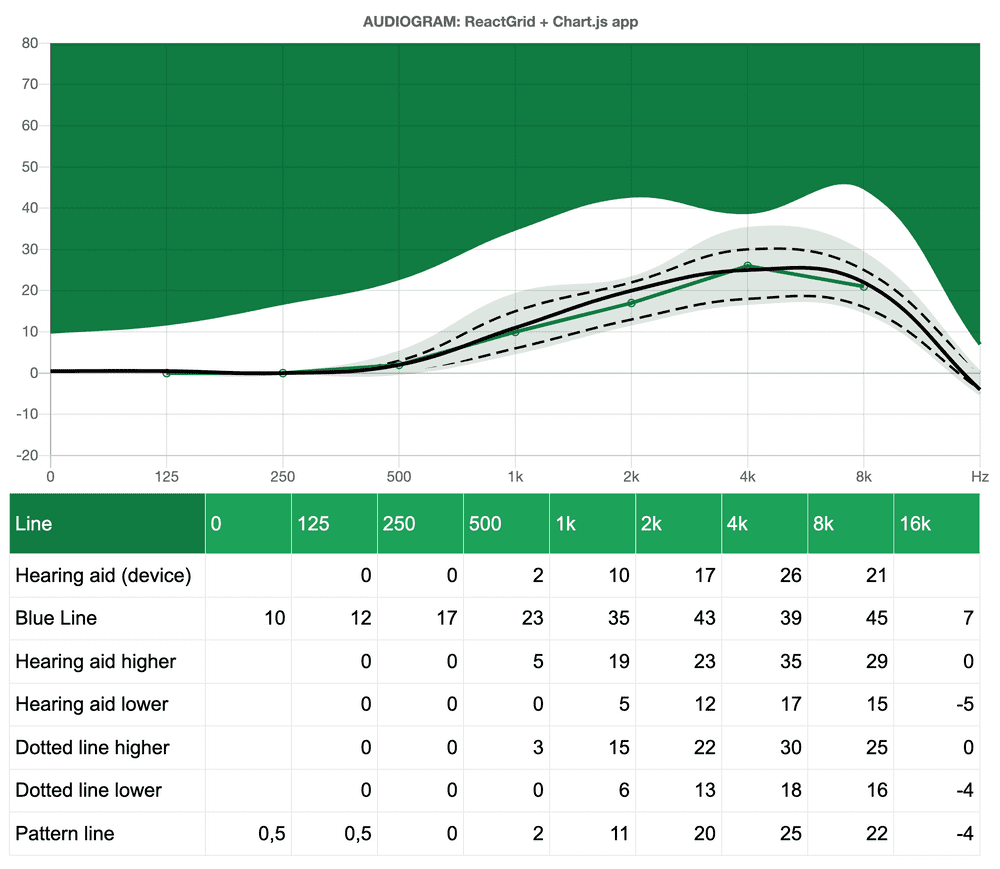
Audiogram app
Why ReactGrid?
There are plenty of different data tables available on the Internet, which perform great if you want to display one object per row. Each of these objects has to have exactly the same static properties, which are mapped to columns in the table.
ReactGrid was designed to be independent of your data model. It doesn’t care about your schema. You can render anything in any cell and thus you are able to display things the way you like it.
Unlike other grid components, ReactGrid also performs great on mobile devices or those with a touch capability and provides the same experience as on a desktop.
Before we get started let’s list three main tasks:
- displaying the collected data will be achieved with ReactGrid. To be reactive we will re-render the view only when the source data has changed. In this example, raw data comes from an audiometer - a device that is used for making hearing tests. In a nutshell, audiometer measures multiple hearing difficulties at many frequencies, and the audiogram is a way of visualizing such disorders.
- visualize the collected data on the line chart using Chart.js and its React wrapper,
- add a possibility to enter a new value and rerender the whole view with an updated state.
#react #javascript #typescript #charts #web-development