Bar Chart Basics with Python’s Matplotlib
When properly presented, and they make it easy to compare categories, visualize trends, missing values, and anomalies.
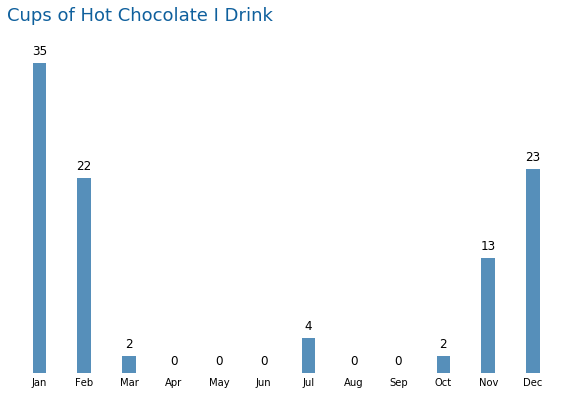
Bar Charts! They are a fantastic form of visualization when properly presented, and they make it easy to compare categories, visualize trends, missing values, and anomalies.
#bar-chart #python #simple #matplotlib
1.55 GEEK