Ever been stuck in traffic and thought — if others drove better I wouldn’t be here? German physicists Kai Nagel and Michael Schreckenberg came up with a fundamental breakthrough in understanding and modeling the emergence of traffic jams. It turns out, traffic jams are not isolated events, in fact, they are extremely predictable.

Simulation of Nagel-Schrekenberg model of traffic at density 0.35 and p=0.3. Colors indicate vehicle speed | Skanda Vivek
In the Nagel-Schrekenberg model, cars are simulated as discrete objects on a grid of cells. At every time step, vehicle positions are updated according to 4 simple rules:
- **Speed limit: **All vehicles drive at speeds between 0 and the speed limit. In the original paper the speed limit is ‘5’, so vehicles drive between 0 and 5.
- Acceleration to speed limit: At every time step, vehicle speeds are updated to their current speed +1, as long as it is below the speed limit.
- **Slowing down if too close to the vehicle in front: **If a vehicle is going to crash into the vehicle in front given its current speed, it is slowed down so as to not crash. For example, say at time t, a vehicle is 3 cells away from the vehicle in front of it and its current velocity is 4. The velocity of the vehicle is slowed down to 2 so that it moves only a distance 2 cells from time t to time t+1, so as to not overlap with the vehicle in front (not cause an accident).
- Random slowing: At every time step, a vehicle reduces its velocity by 1 with a certain probability, p. If p=0.5, then every vehicle has a 50% chance of slowing down at every timestep. In this case if the velocity is 3, it is reduced to 2, 50% of the time. This represents the human imperfection aspect, that nucleates traffic jams.
In the video, you see vehicles moving to the right and jams nucleating (patches of red vehicles) combined with bursts of fast moving vehicles (green). This captures stop-and-go traffic jams. Density of 0.35 denotes that 35% of cells are occupied by vehicles. If you have a 100 cell grid, that means 35 of them are filled with vehicles.
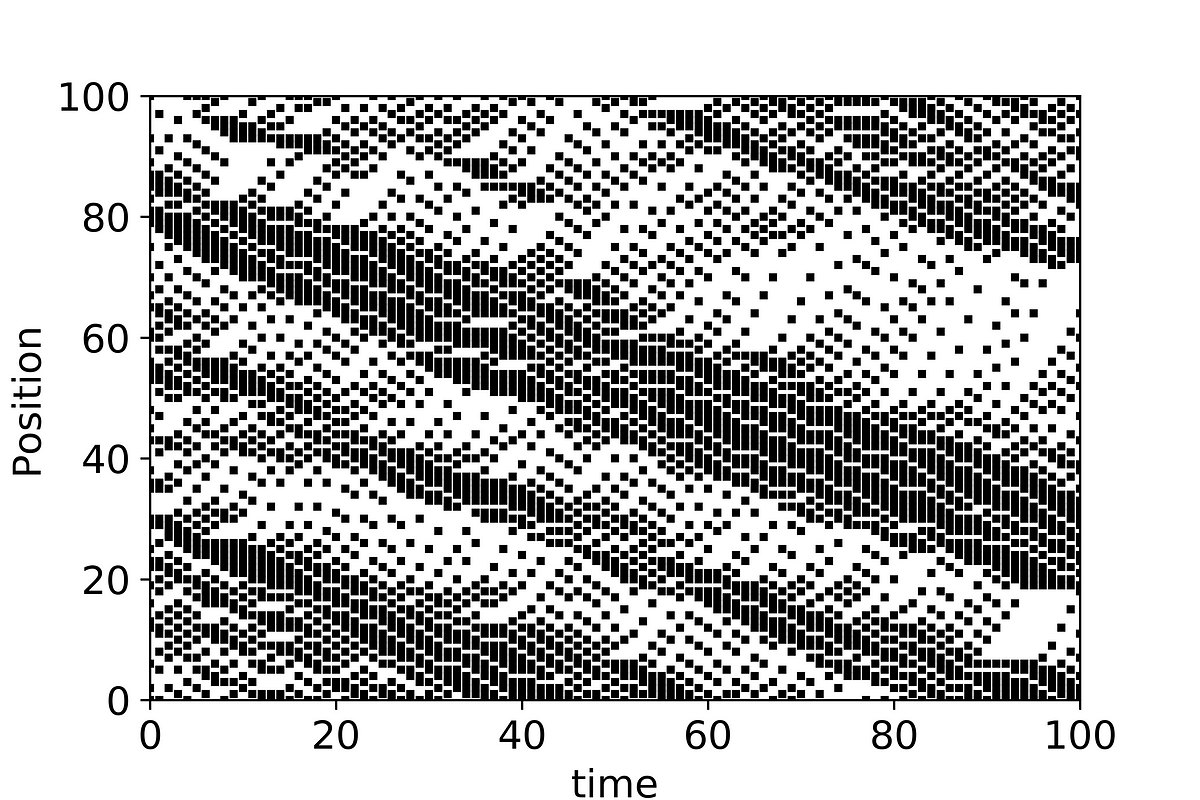
Space-time plots to visualize traffic jams
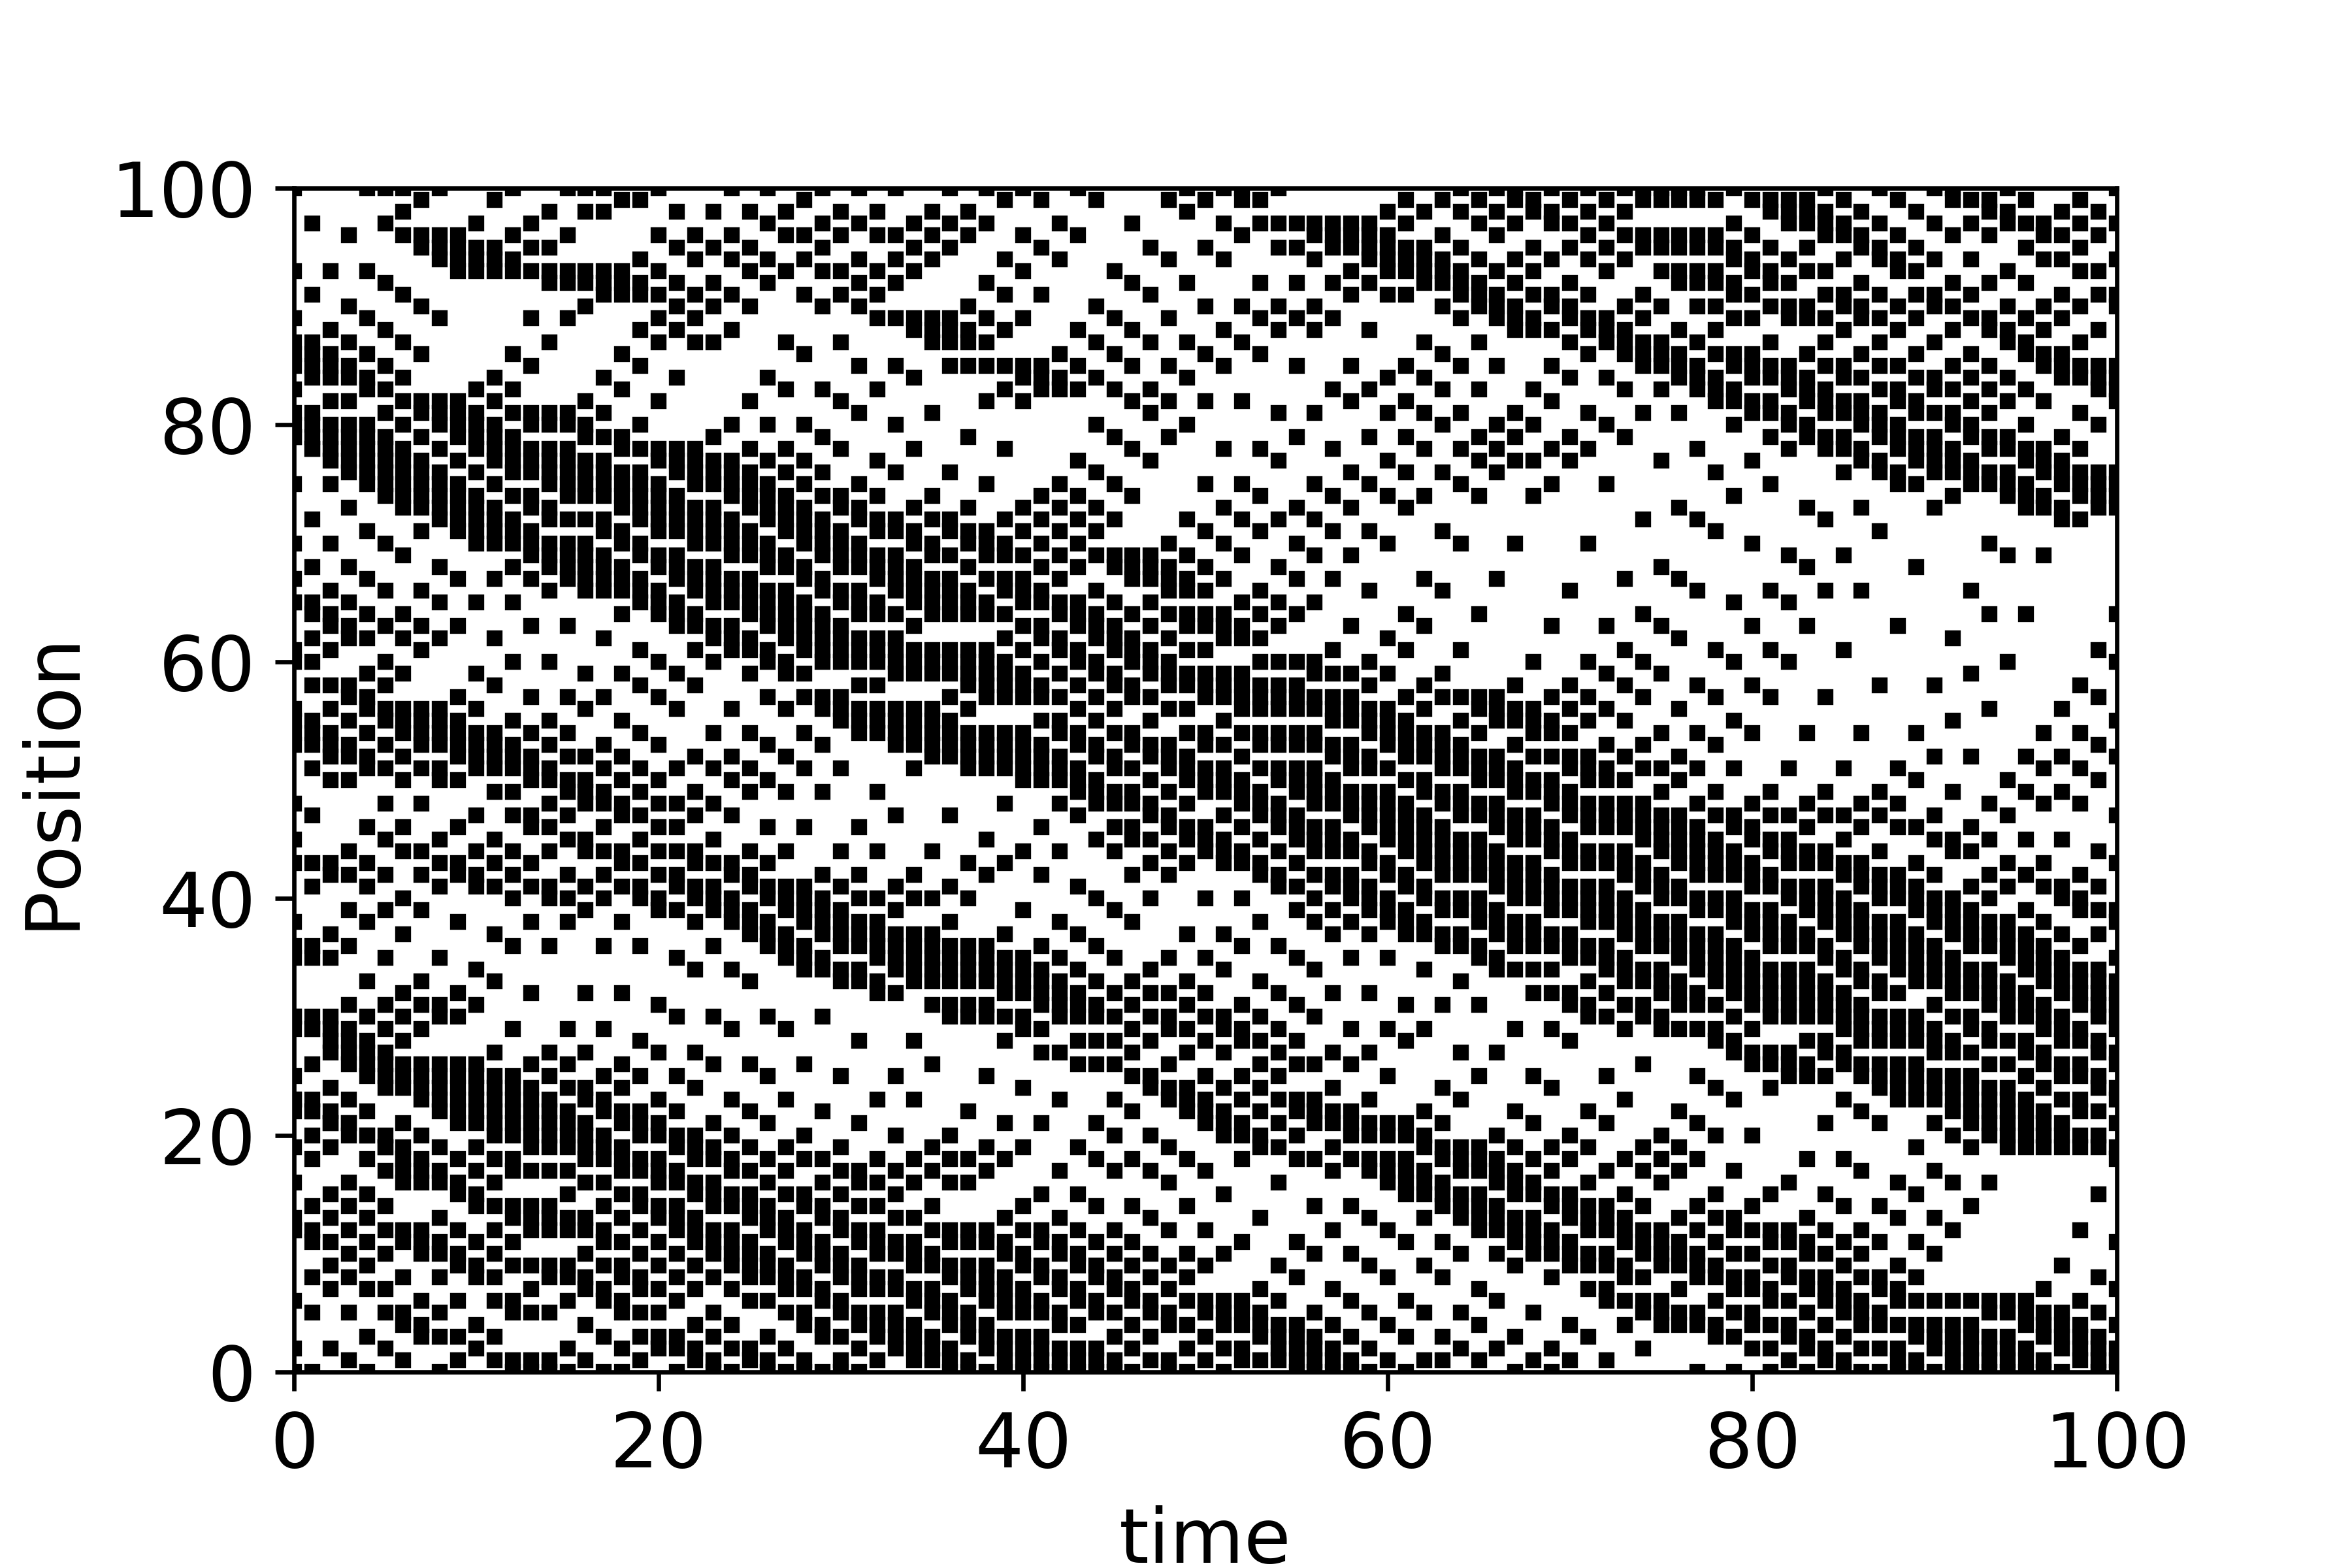
Space-time diagram for Nagel-Schrekenberg model with density 0.35 and p=0.3 | Skanda Vivek
A common way to visualize traffic flow is a space-time plot. Dark black regions illustrate vehicle density waves. The negative slope shows that an initially upstream traffic jam that originates at time t=0 propagates downstream at later times. E.g. the jam originating at position 80 affects position 30 at t=100.
#traffic #science #visualization #complexity #data #data analysis