Recently I have been working with Azure Analysis Services (AAS) quite a lot. The number of tables in our model was quickly growing and processing times were fluctuating and increasing as well. Reason enough for me to find out a little bit more about which tables were taking up the most processing time from the AAS perspective.
Here I will explain the steps I took to get detailed information about the processing steps for an Azure Analysis Services Full Process from a Log Analytics workspace into a Power BI report.
- Setting up Diagnostics Logging to Log Analytics workspace
- Exploring the Logs with the Kusto Query language
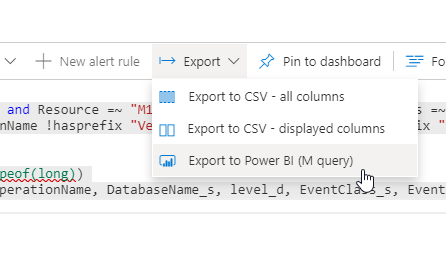
- Getting the data into Power BI
Diagnostic Logs
The starting point, as always, was the Microsoft documentation. Okay, actually it was Google or Bing. But quickly I landed on the documentation pages that include all the need steps to start. The link is listed below.
The configuration of the Diagnostics Settings, to send the logs to a Log Analytics workspace, was already done in this case. If you still need to do this, the docs include the needed actions. It’s pretty straight forward.
Exploring the Logs
The next step is exploring the logs in our Log Analytics workspace (LAW) by writing a query to get the information we are looking for. The first example query from the documentation was a good starting point. But not exactly what we are looking for, since we are looking for the Refresh of the model. And not the query times.
In the end, I wrote** two queries and join these together in Power BI**. In the first query, I am specifically looking for the highest level of the refresh process.
The value ‘CommandEnd’ in the ‘OperationName’ field and the ‘TextData_s’ field filtered on ‘<Refresh ’ does the trick in this case. Below is the query, if you want to use it, don’t forget to add your own server and database name in the second line.
let window = AzureDiagnostics
	| where ResourceProvider == "MICROSOFT.ANALYSISSERVICES" and Resource =~ "<MyServerName>" and DatabaseName_s =~ "<MyDatabaseName>"
	| where TimeGenerated > ago(14d);
	window
	| where OperationName has "CommandEnd" and TextData_s has "<Refresh "
	| extend DurationMs=extract(@"([^,]*)", 1,Duration_s, typeof(long))
	| project StartTime_t,EndTime_t,ServerName_s,OperationName,RootActivityId_g,TextData_s,DatabaseName_s,ApplicationName_s,Duration_s,Success_s,EffectiveUsername_s,User_s,EventSubclass_s,DurationMs
	| order by StartTime_t desc
view raw
AASRefreshDiagnosticLog01.kql hosted with ❤ by GitHub
In the second query, we get the details of the refresh and we want to filter out as many operations that we do not use. This query results in all the detailed information we are looking for.
let window = AzureDiagnostics
	| where ResourceProvider == "MICROSOFT.ANALYSISSERVICES" and Resource =~ "<MyServerName>" and DatabaseName_s =~ "<MyDatabaseName>"
	| where OperationName !hasprefix "Discover" and OperationName !hasprefix "VertiPaq" and OperationName !hasprefix "LogMetric"
	| where TimeGenerated > ago(14d);
	window
	| extend DurationMs=extract(@"([^,]*)", 1,Duration_s, typeof(long))
	| project TimeGenerated,RootActivityId_g, ResourceId, OperationName, DatabaseName_s, level_d, EventClass_s, EventSubclass_s, StartTime_t, EndTime_t, ProgressTotal_s, ObjectReference_s, ObjectName_s, ObjectID_s, ObjectPath_s, Duration_s, CPUTime_s, Severity_s, Success_s, Error_s, TextData_s,DurationMs
	| order by TimeGenerated desc
view raw
AASRefreshDiagnosticLog02Details.kql hosted with ❤ by GitHub
Another option, to get fewer results in the last query, is to join it to the first query on the ‘RootActivityId_g’. That way you make sure you only get data that relates to the first query.
#cloud #azure-analysis-services #azure #analysis-services #power-bi #data analysis