do the heavy lifting. I learned this the hard way during my first Exploratory Data Analysis project at Metis, an immersive data science bootcamp.
Faced with a short window of time and a notoriously messy MTA dataset detailing turnstile traffic in NYC, I invested the bulk of my efforts toward data cleaning. That choice left me with some less than stellar visuals on presentation day, and the valuable lesson that no matter how diligent your analysis may be, it doesn’t do you any good if you end up confusing your audience (especially a less technical one).
Humbled by that experience, I took the time to renovate each of my visuals from that project. In this article, I will share a few simple but powerful principles that I have learned, each of which you can easily incorporate into your next presentation. If you want to learn more, I recommend reading Storytelling with Data by Cole Nussbaumer Knaflic, which inspired many of my design choices.
All visuals were created using Matplotlib, and EDA was conducted using Python and Pandas — feel free to check out the Github repo for this project as well.
Know your audience
Understanding your audience, and how they already perceive you, is the first factor that will position you for effective communication. For this example, I was presenting to a fictitious client who already trusted me as an expert, so there was no need to establish credibility, but this is still an important consideration that can impact the order and flow of your overarching story.
Specifically, my goal was to provide the client (a tech non-profit) with subway station recommendations that would maximize the outreach and engagement of their fundraising street team.
Example 1: Use Color Strategically
One of the first consequences of exploring the data was the observation that different stations were more active at different times of the day. With the accompanying visual, my goal was to highlight some extreme examples and ensure that our client could target the right stations at the right times.
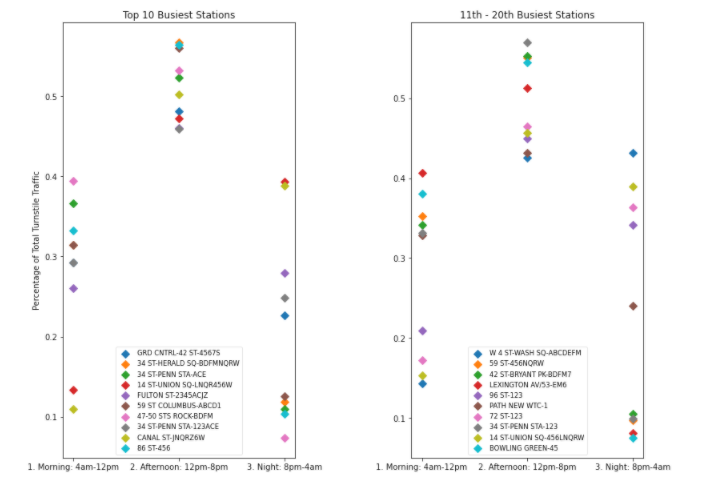
What is the first word that comes to your mind as you start to decipher this graph? Probably something along the lines of “busy” or “exhausting.” I could start with any number of issues, but the first I want to highlight is the use of color. Each plot has ten different colors, overlapping data points, and an oddly placed legend. Unfortunately, our brains can only keep about four chunks of visual information in our short-term memory at a given time. Limiting the cognitive burden on your audience is a must, so this is the first thing I needed to fix.
It is also unclear what takeaway I intended my audience to get from this visual. Lack of contrast makes the information far too difficult to interpret. Take a look at how my second attempt uses color and contrast more strategically and stands alone without needing more explanation.
#data-visualization #matplotlib #visualization #data-science #design-thinking