This is the fourth post in the series: Visualizing ASP.NET Core 3.0 endpoints using GraphvizOnline.
- Part 1 - Visualizing endpoints using the DOT language
- Part 2 - Adding an endpoint graph to your ASP.NET Core application
- Part 3 - Creating a custom DfaGraphWriter using ImpromptuInterface for easier reflection
- Part 4 - Creating a custom endpoint visualization graph (this post)
- Part 5 - Detecting duplicate routes in ASP.NET Core
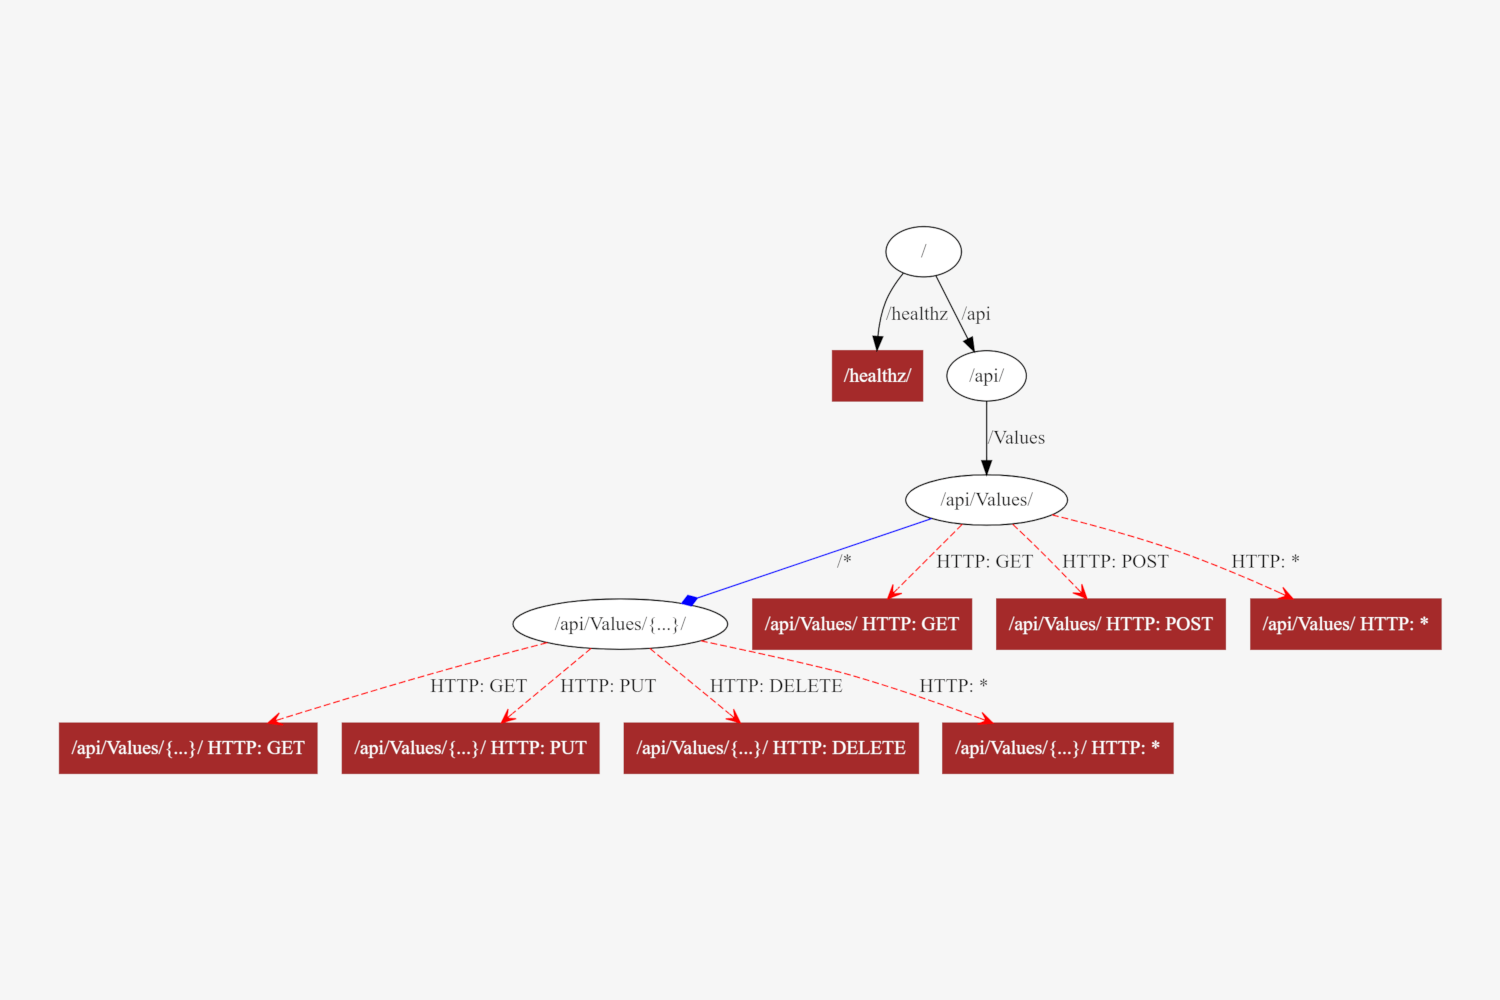
In this series, I’ve been laying the groundwork for building a custom endpoint visualization graph, as I showed in my first post. This graph shows the different parts of the endpoint routes: literal values, parameters, verb constraints, and endpoints that generate a result:
In this post I show how you can create an endpoint graph like this for your own application, by creating a custom DfaGraphWriter.
This post uses techniques and classes from the previous posts in the series, so I strongly suggest reading those before continuing.
Adding configuration for the endpoint graph
The first thing we’ll look at is how to configure what the final endpoint graph will look like. We’ll add configuration for two types of node and four types of edge. The edges are:
- Literal edges: Literal matches for route sections, such as
apiandvaluesin the routeapi/values/{id}. - Parameters edges: Parameterised sections for routes, such as
{id}in the routeapi/values/{id}. - Catch all edges: Edges that correspond to the catch-all route parameter, such as
{**slug}. - Policy edges: Edges that correspond to a constraint other than the URL. For example, the HTTP verb-based edges in the graph, such as
HTTP: GET.
and the nodes are:
- Matching node: A node that is associated with an endpoint match, so will generate a response.
- Default node: A node that is not associated with an endpoint match.
Each of these nodes and edges can have any number of Graphviz attributes to control their display. The GraphDisplayOptions below show the default values I used to generate the graph at the start of this post:
public class GraphDisplayOptions
{
    /// <summary>
    /// Additional display options for literal edges
    /// </summary>
    public string LiteralEdge { get; set; } = string.Empty;

    /// <summary>
    /// Additional display options for parameter edges
    /// </summary>
    public string ParametersEdge { get; set; } = "arrowhead=diamond color=\"blue\"";

    /// <summary>
    /// Additional display options for catchall parameter edges
    /// </summary>
    public string CatchAllEdge { get; set; } = "arrowhead=odot color=\"green\"";

    /// <summary>
    /// Additional display options for policy edges
    /// </summary>
    public string PolicyEdge { get; set; } = "color=\"red\" style=dashed arrowhead=open";

    /// <summary>
    /// Additional display options for node which contains a match
    /// </summary>
    public string MatchingNode { get; set; } = "shape=box style=filled color=\"brown\" fontcolor=\"white\"";

    /// <summary>
    /// Additional display options for node without matches
    /// </summary>
    public string DefaultNode { get; set; } = string.Empty;
}
#asp.net core #routing