Your innovative idea may come from a detail exploration of your data. Most of the cases that data will contain both continuous and categorical variables. You will need to find explainable pattern from this. What if it can be displayed methodologically in a single diagram and you can do it with simple and short lines of coding?
Why R?
R is an open-sourced programming language for statistical computing and graphics supported by the R Foundation for Statistical Computing. It is easy to learn and comfortable to work with its widely used integrated development environment- RStudio.
Install Packages
First of all we need to install required packages with the below codes.
install.packages("tidyverse")
install.packages("GGally")
install.packages("ISLR")
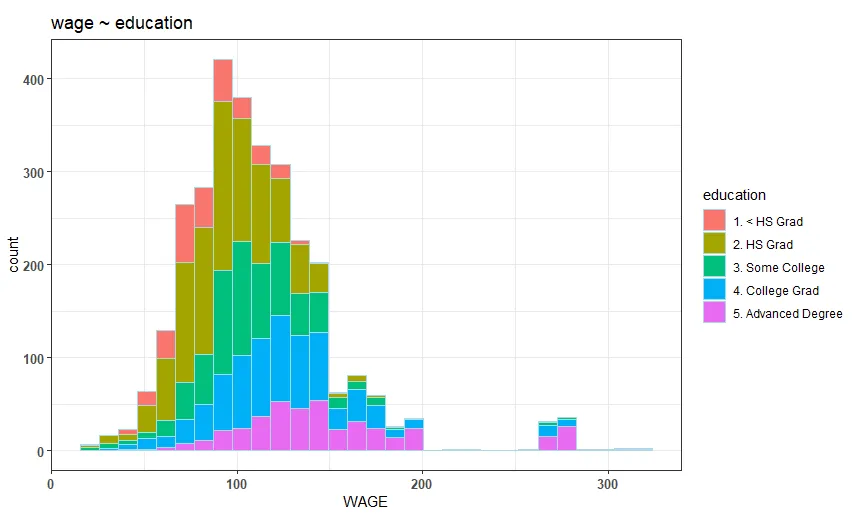
The ‘tidyverse’ package is for data wrangling & data visualization. The widely used ‘ggplot2’ package is encapsulated in the ‘tidyverse’. ‘GGally’ reduces the complexity of combining geometric objects with transformed data by adding several functions to ‘ggplot2’. We will use _Mid-Atlantic Wage Dat_a for this exercise which contains wage data for a group of 3000 male workers in the Mid-Atlantic region of US. **‘ISLR’ **package is required to load this dataset.
Load Packages
The packages need to be installed once but every time you run your script you need to load the packages with the **library** function.
library(tidyverse)
library(GGally)
library(ISLR)
#analytics #data-science #innovation #visualization #r