Big Data Analysis within a real-life example of digital music service

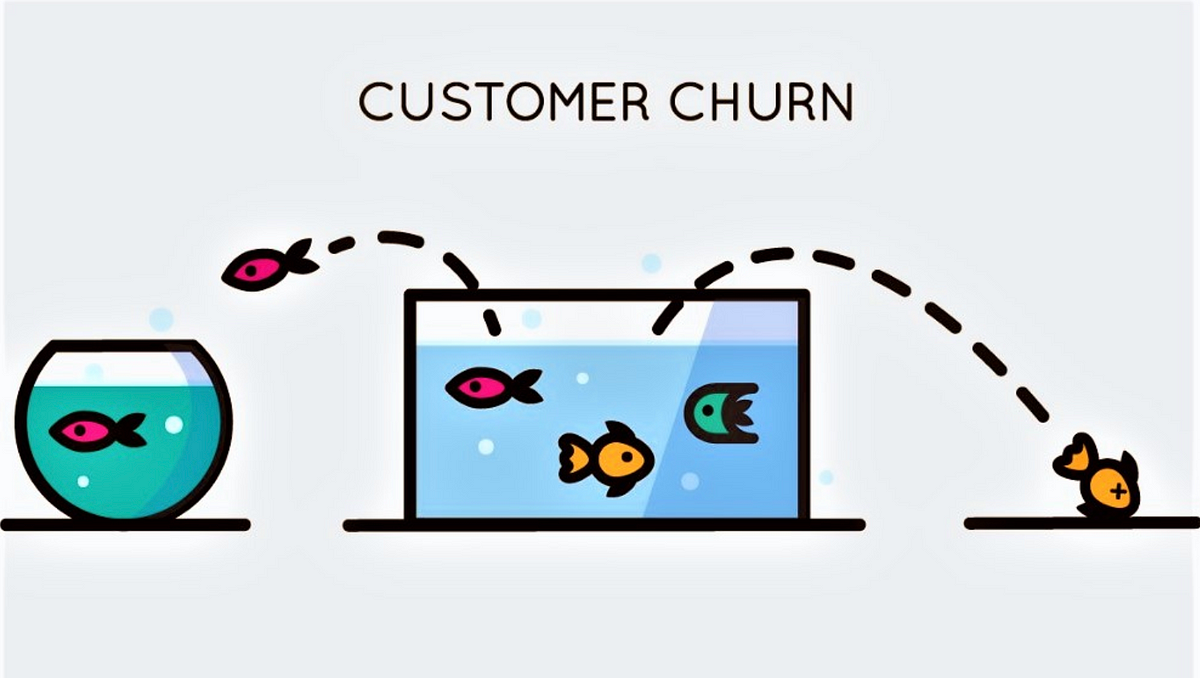
Customer Churn
Customer churn is a key predictor of the long term success or failure of a business. It is the rate at which customers are leaving your business and taking their subscription dollars elsewhere. For every single business, why the users churn and how to change, keep, attract the users is the forever questions they ask themselves.

From Big Cloud
Digital Music Service, as an example for us here to look into. Let’s think of the most familiar platform, like Spotify, Pandora. Every time when you, as the user interact with the service, every small step, such as playing music, logging out the page, like the song, etc, generate the data. Here comes the Big Data! All these data contain the key insight for predicting the churn of the users and keeping the business thrive. Because of the size of the data, it is a challenging and common problem that we regularly encounter in any customer-facing business.
Here we are going to analyze the real-life large datasets for a music streaming service with Spark. We attempt to build machine learning models to predict the churning possibilities of the users and understand the features that contribute to the churning behaviors.
Let’s start with a mini-subset (~128MB) of the large data (12 GB) first for understanding and exploring the datasets. We will load in our dataset (JSON format) through the following commands:
## Create a Spark session
spark = (SparkSession.builder
                     .master(“local”)
                     .appName(“sparkify”)
                     .getOrCreate())
## Read the dataset
events_df = spark.read.json(‘mini_sparkify_event_data.json’)
We can also take a look at the shortcut of all the features and their datatype
root
 |-- artist: string (nullable = true)
 |-- auth: string (nullable = true)
 |-- firstName: string (nullable = true)
 |-- gender: string (nullable = true)
 |-- itemInSession: long (nullable = true)
 |-- lastName: string (nullable = true)
 |-- length: double (nullable = true)
 |-- level: string (nullable = true)
 |-- location: string (nullable = true)
 |-- method: string (nullable = true)
 |-- page: string (nullable = true)
 |-- registration: long (nullable = true)
 |-- sessionId: long (nullable = true)
 |-- song: string (nullable = true)
 |-- status: long (nullable = true)
 |-- ts: long (nullable = true)
 |-- userAgent: string (nullable = true)
 |-- userId: string (nullable = true)
The feature page seems to be the most important one as it records all the user interactions. The page column recorded values, such as Logout, Save Settings, Roll Advert, Settings, Submit Upgrade, Cancellation Confirmation, Add Friends, etc. Also, the Cancellation Confirmation events of page define the churn that we are interested in. (0 as un-churn, and 1 as churn)
Exploratory Data Analysis (EDA)
We want to perform some exploratory data analysis to observe the behavior for users who stayed vs users who churned.
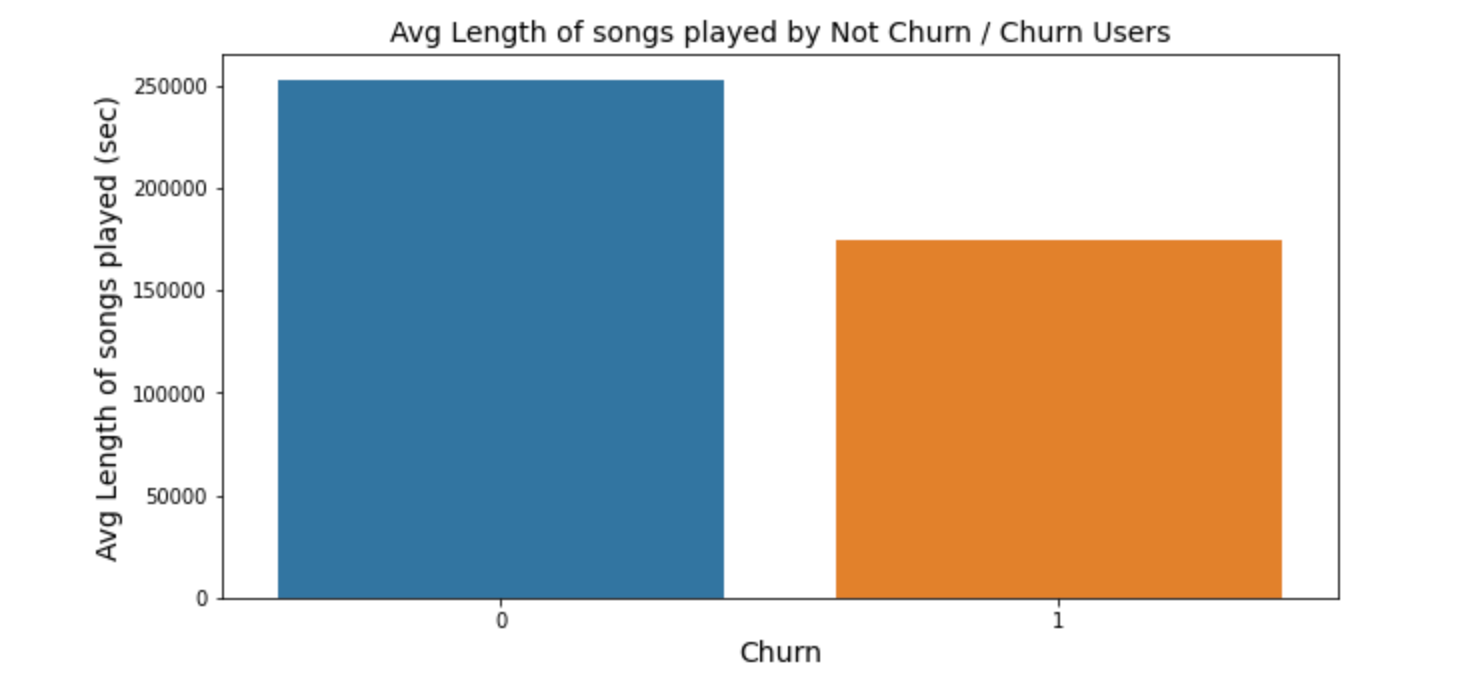
From the bar plot on the left, the average length of songs played for churn and un-churn users is generated. For un-churned users, they have longer mean length for listening to the songs compare to the other group.
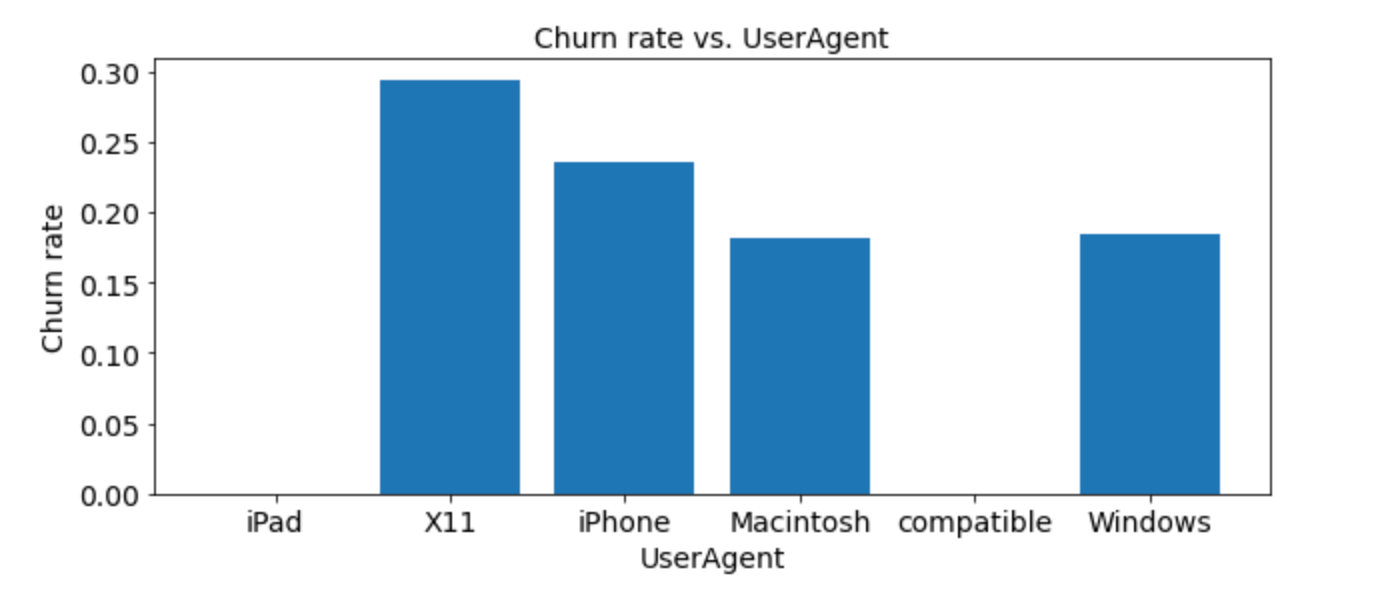
The second bar chart shows the** relationship of the churn rate and User-Agent of the users**. From the data, we can conclude that X11 and iPhone users tend to churn more and this can give us some insights for further investigation of the systems.
#data-science #churn #streaming-music-service