In our quest to summarize data, either via data tables or visual effects, we wanted to represent the entirety of the data. However, often we have wished there was a single point that was representative of the data at hand. Using any extreme value in the data series would only explain one end of the series. So, it may be useful to use a central value with some observations larger or smaller than it. Such a measure is called central tendency. However, does a central point tell the entire story? You know some values are larger or smaller than the central tendency value, however it does not talk about the spread or heterogeneity in the data. This is what dispersion measures. The two concepts form a foundation for many advanced statistical concepts.
The aim of this article is to describe the different measures of central tendency and also introduce a bit of simple python coding to explain how to see them in practice. I’ll attempt to share some knowledge on dispersion in a follow up article.
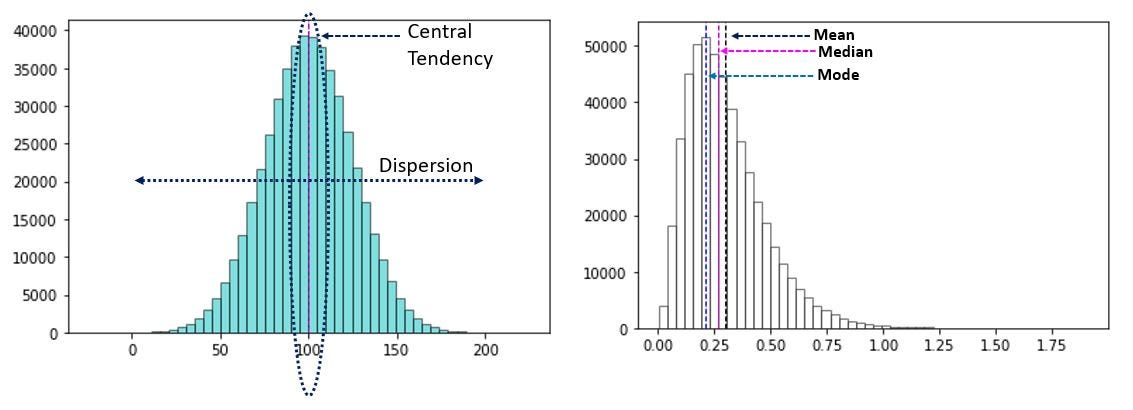
Fig 1: Central Tendency & Dispersion of plotted data in images
Central Tendency
Different measures of central tendency can be easily demonstrated by the below chart:
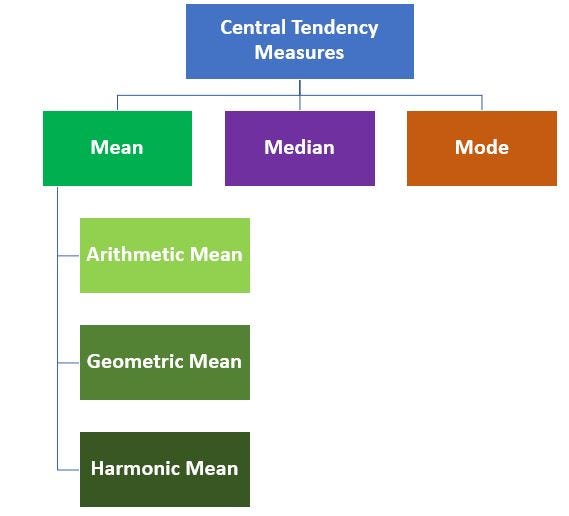
Fig 2: Different Measures of Central Tendency
As evident from the image, central tendency can be classified into 3 classes — mean, median and mode. Before we get into the details of each, it is worth taking a look at the requisite properties of an ideal measure of central tendency as defined by Prof. Udny Yule:
- The measure needs to be based on all observations in the data,
- based on all observations,
- affected as little as possible by sampling fluctuations
- rigidly defined, easy to calculate, readily comprehensible and
- there is possibility to do further mathematical work
With this in mind, let us take a look at different measures of Central Tendency below. Also, 2 noteworthy concepts to note here are population and sample. Population is the collection of all possible observations in a data set while sample is a subset drawn from the population using different techniques.
Mean
The mean is calculated by various mathematical operations on all observations in a data series:
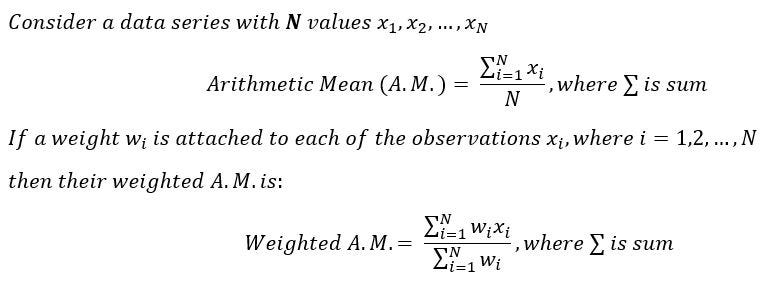
- **Arithmetic Mean: **One of the easiest to calculate measures, arithmetic mean is defined as the sum of all observations in a data series divided by the count of all observations in that series. Mathematically,
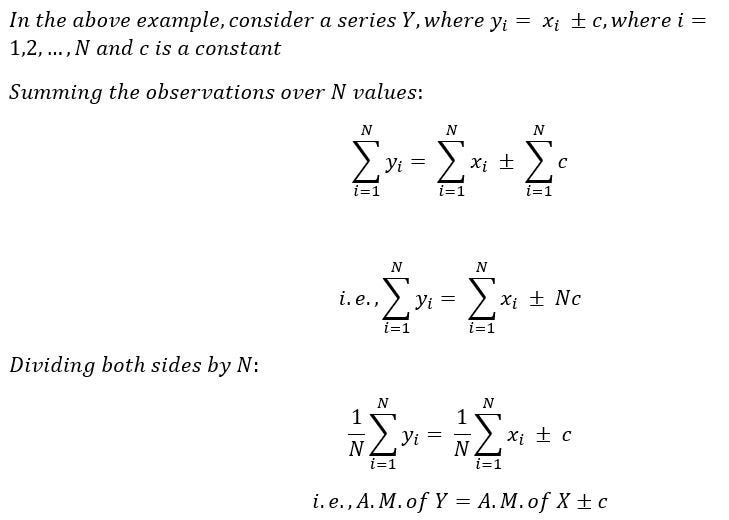
One interesting property of A.M. to note here is that if each observation in a series is increased or decreased by the same constant, the A.M. of the new series would also increase or decrease by the same constant.
- Geometric mean: Geometric Mean is defined as the n-th root of the product of n observations in a data series. Mathematically,
If the calculations can be taken a bit further, it is very easy to see that usage of logarithms can make the calculations easier.
#statistics #statistical-analysis #data analysis