Hello everyone! Recently I had to do some visualizations for my university project, I’ve done some googling and haven’t found any simple guides on how to put Plotly plots on an HTML page.
Before we start I assume that you have running the Django HTML page. Why Plotly? Plotly allows you to make interactive, beautifully designed plots in a matter of minutes. Despite that originally Plotly is a Python library, we won’t use any Python programming today.
For those who don’t have much time, here is the short guide:
- Go to Plotly Chart Studio, create your account.
- Click on the “Create” button and choose “Chart”.
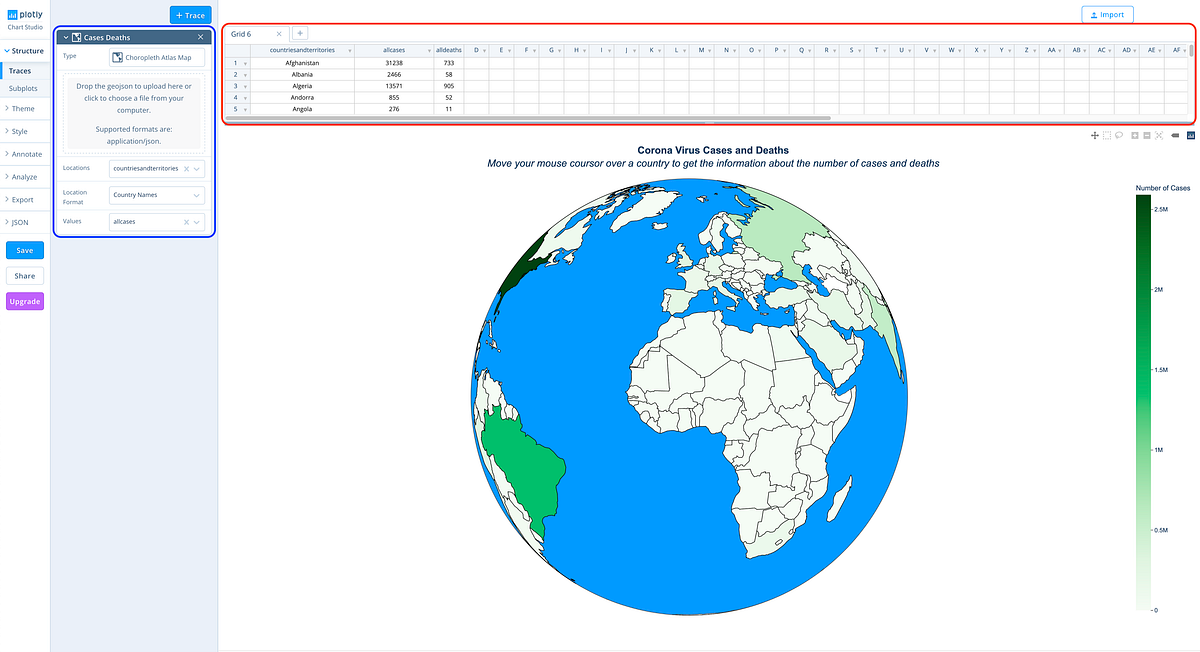
- Import your data and click on the “Trace” button.
- Choose the type of plot you want.
- Once you made your dream-plot, save it, setting all the settings to “Public”.
- Share your plot, by copying iframe code from the “Embed” tab and past it to the body of your HTML page.
Now for those who have time, let’s see in detail how we can get the same result, as you saw at the beginning.
Step 1. Creating an account and uploading the data.
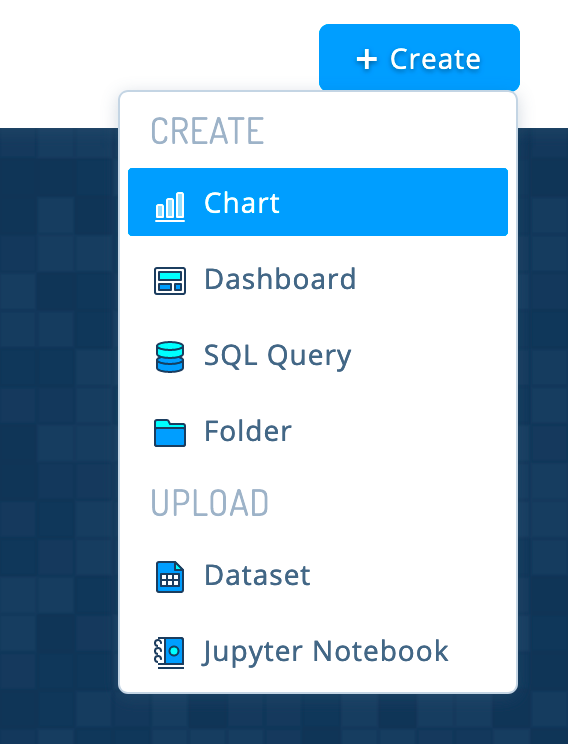
We will use Plotly Chart Studio. Once you’ve signed up, you’ll see “Create” in the upper-right corner.
To create our visualizations we have to import our data first. The data can be either CSV, single-sheet Excel file, link to a CSV file or the data got using SQL and Falcon SQL client.
Once you uploaded your data, you’ll see it in the table (red square) on the top of your screen.
#html #plotly #django #visualization