Plot Machine Learning & Deep Learning Clustering with interactive Maps
Summary
In this article, using Data Science and Python, I will show how different Clustering algorithms can be applied to Geospatial data in order to solve a Retail Rationalization business case.
Store Rationalization is the reorganization of a company in order to increase its operating efficiency and decrease costs. As a result of the Covid-19 crisis, several retail businesses from all around the world are closing stores. That is not exclusively a symptom of financial distress, in fact many companies have been focusing their investments on making their business more digital.
Clusteringis the task of grouping a set of objects in such a way that observations in the same group are more similar to each other than to those in other groups. It is one of the most popular applications of the Unsupervised Learning (Machine Learning when there is no target variable).
Geospatial analysis is the field of Data Science that processes satellite images, GPS coordinates, and street addresses to apply to geographic models.
In this article, I’m going to use clustering with geographic data to solve a retail rationalization problem. I will present some useful Python code that can be easily applied in other similar cases (just copy, paste, run) and walk through every line of code with comments so that you can replicate this example (link to the full code below).
mdipietro09/DataScience_ArtificialIntelligence_Utils
I will use the “Starbucks Stores dataset” that provides the location of all the stores in operation (link below). I shall select a particular geographic area and, in addition to the latitude and longitude provided, I will simulate some business information for each store in the dataset (cost, capacity, staff).
Starbucks Locations Worldwide
Name, ownership type, and location of every Starbucks store in operation
In particular, I will go through:
- Setup: import packages, read geographic data, create business features.
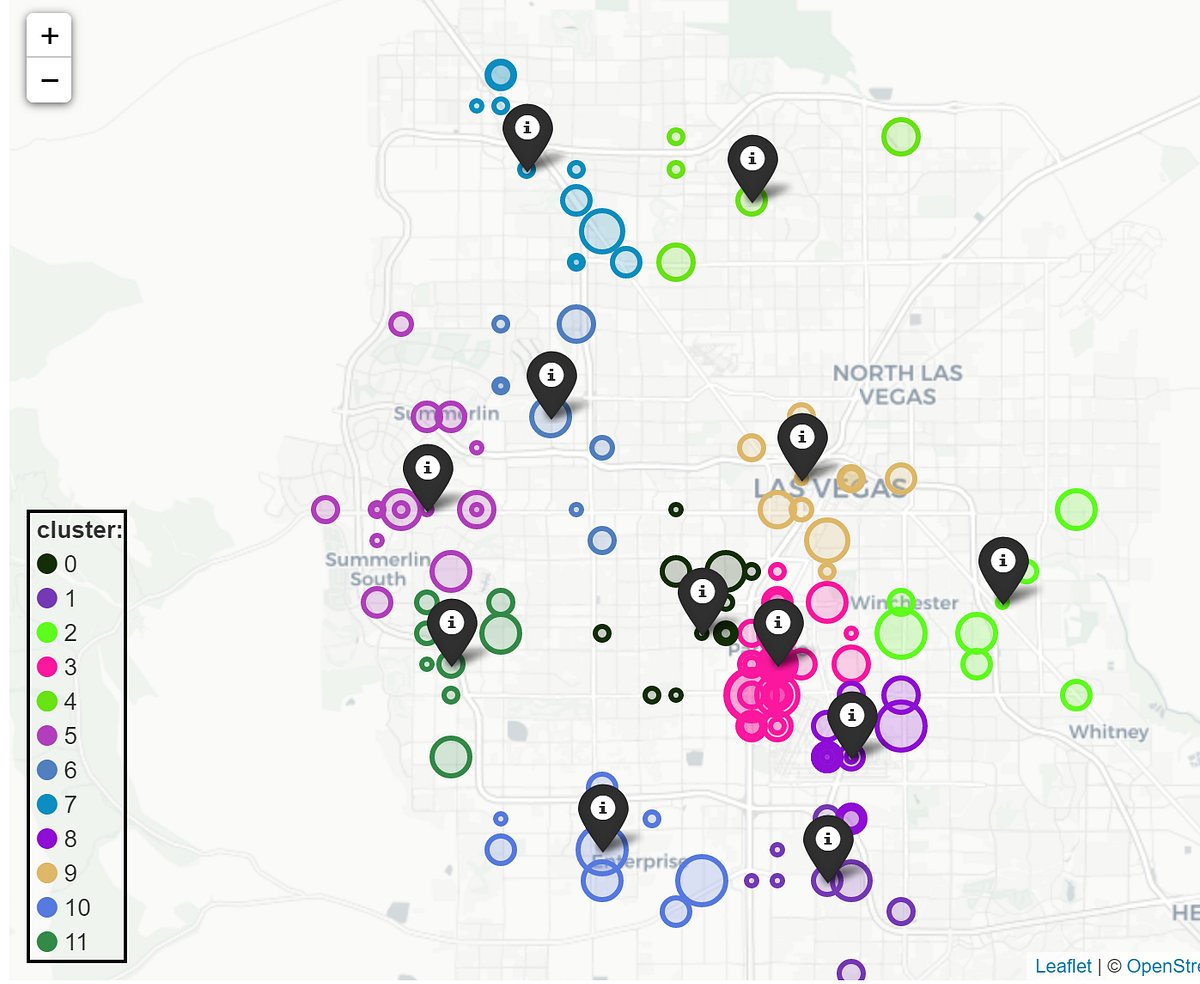
- Data Analysis: presentation of the business case on the map with _folium _and geopy.
- Clustering: Machine Learning (K-Means / Affinity Propagation) with scikit-learn, Deep Learning (Self Organizing Map) with minisom.
- Store Rationalization: build a deterministic algorithm to solve the business case.
Setup
First of all, I need to import the following packages.
## for data
import numpy as np
import pandas as pd

## for plotting
import matplotlib.pyplot as plt
import seaborn as sns
## for geospatial
import folium
import geopy
## for machine learning
from sklearn import preprocessing, cluster
import scipy
## for deep learning
import minisom
Then I shall read the data into a pandas Dataframe.
dtf = pd.read_csv('data_stores.csv')
The original dataset contains over 5,000 cities and 25,000 stores, but for the purpose of this tutorial, I will work with just one city.
filter = "Las Vegas"
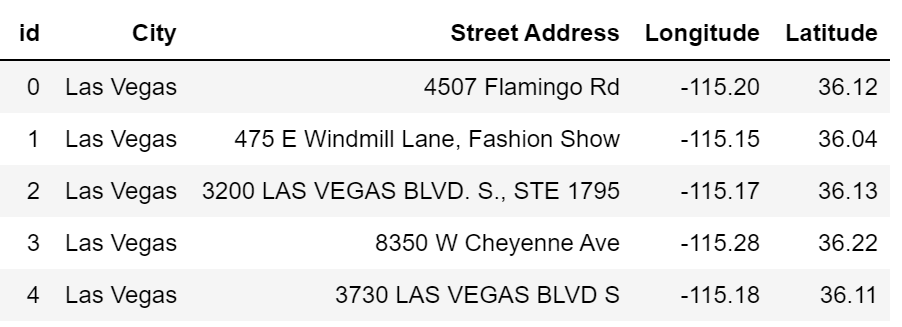
dtf = dtf[dtf["City"]==filter][["City","Street Address","Longitude","Latitude"]].reset_index(drop=True)
dtf = dtf.reset_index().rename(columns={"index":"id"})
dtf.head()
In that area, there are 156 stores. In order to proceed with the business case, I’m going to simulate some information for each store:
- Potential: total capacity in terms of staff (e.g. 10 means that the store can have up to 10 employees)
- Staff: current staff level (e.g. 7 means that the store is currently operating with 7 employees)
- Capacity: current left capacity (e.g. 10–7=3, the store can still host 3 employees)
- Cost: annual cost for the company to keep the store operating (“low”, “medium”, “high”)
#data-science #programming #machine-learning #data analysis