It is very important as a data analyst or data scientist, one has to assess a sample data at first, source of sample data can be primary or secondary but it is very important to analyze the nature of the data.
Let’s put this into a hypothesis as follows,
NULL Hypothesis: On average, sample data distribution is normal
**ALTERNATE Hypothesis: **On average, sample data distribution is not normal
What does it mean? Hypothesis Formulations
Let us see, here we have put the null hypothesis as data is normally distributed, typically it depicts that if data is normal then we will not take any action and we will proceed for building a prediction model.
In case of alternate hypothesis, it depicts that if data is not normally distributed then we will have to take any action before proceeding for building a prediction model, typical action as a data scientist can be the normalization of a data once this corrective action is taken then only he or she will proceed for building a prediction model.
Strategies to test normality of data
Now in order to test whether a sample data is normal or not, we will decide strategies at first that are as follows,
Data Visualization Methods:
These will visualize the nature of data but not able to quantify the same.
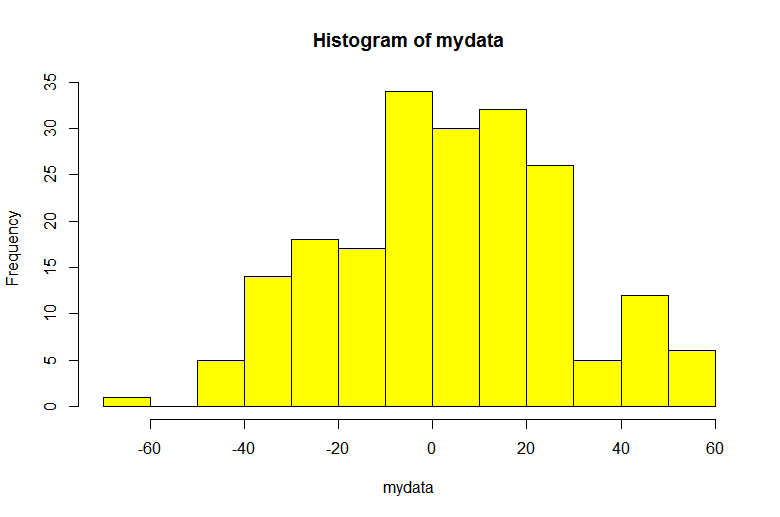
- Plotting a histogram, graphical distribution of frequencies within the range
- Plotting Q-Q plot, a graphical method for comparing of probability distributions.
#r-programming #exploratory-data-analysis #data-normalization #data-visualization #data-science