In Azure DevOps Dashboard, we configure Widgets to display information and charts. Most of the widgets are configurable and connect with an Azure DevOps Query. If you are familier with Azure DevOps Dashboard creation, this would be a widespread activity. When we use Group By, we used all the related columns and properties to filter out the data. Now, Azure DevOps support the Group By Tags in the chart widget by default. When using the charts widget, you will find an option available for tags.
Azure DevOps Dashboard – Using Group By Tags
Using Group By Tags, you can visualize the query information by selecting all tags or a set of tags in the widget.
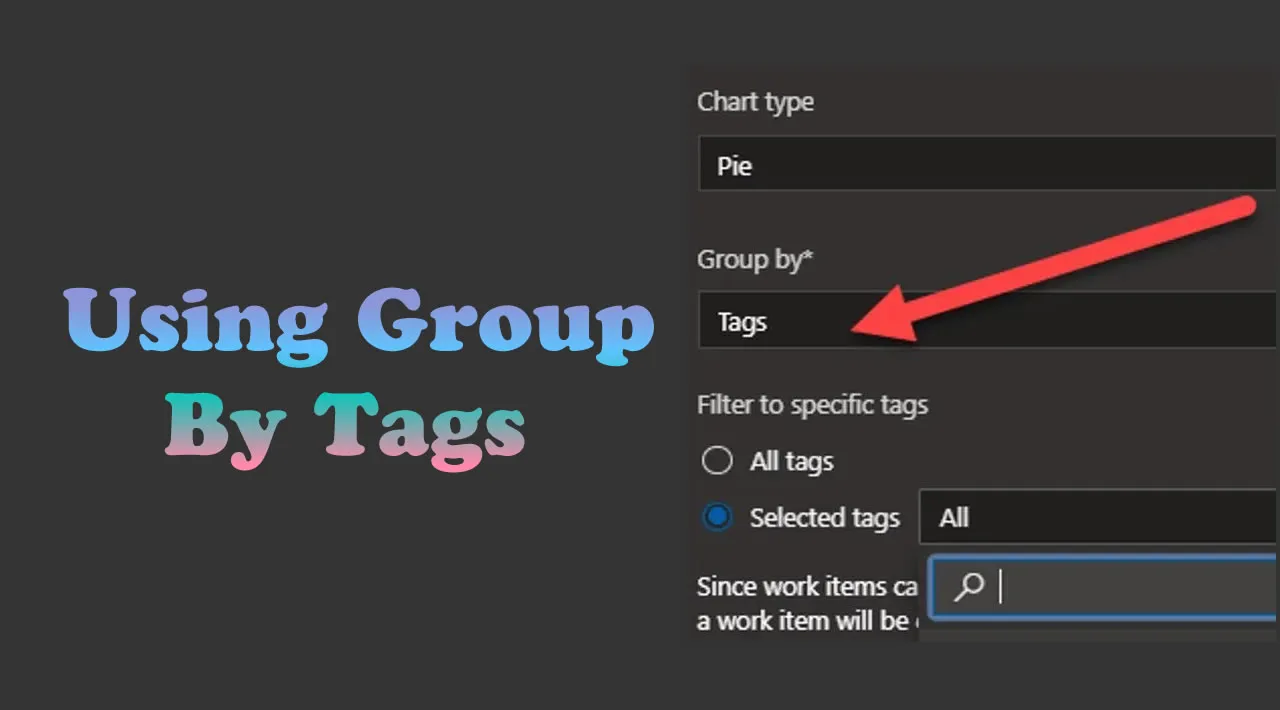
To start with, Add a Chart Widget in the dashboard, then select the configuration. In the configuration tab, you can choose the Chart Type and corresponding Group By filed.
When you choose “Tags” as Group By Type, you can choose either All Tags, or filter by selected Tags as well.
#devops