Background
Over the last several months, I’ve been working at the Discourse Processing Lab at Simon Fraser University (under the leadership of Dr. Maite Taboada), where we’ve been actively developing and extending the Gender Gap Tracker, an automated Natural Language Processing (NLP) system that measures men and women’s voices on seven major Canadian news outlets in real time. The Gender Gap Tracker is a collaboration between Informed Opinions, a non-profit dedicated to amplifying women’s voices in the media and Simon Fraser University, through the Discourse Processing Lab and the Big Data Initiative.
At a high level, we perform the following steps on a daily basis to generate statistics that allow us to quantify the number of men and women quoted in the news:
- Scrape the text and metadata of news articles from the daily web content of seven Canadian English-language news outlets.
- Process each article’s text using a variety of NLP techniques (syntactic parsing, named entity recognition, quote extraction) and gender services in order to identify quoted people and their genders.
- Compute and store individual/aggregated statistics that measure the number of quoted people (i.e., sources) from either gender.
Disclaimer: We acknowledge that gender is non-binary, and that there are different social, cultural, and linguistic conceptualizations of gender. For this project, we rely on name lookups from internal/external gender services in order to classify people mentioned and quoted as female, male, or other.
In addition to our daily pipeline, we also run a monthly topic modelling pipeline that performs large-scale discovery of topics using Latent Dirichlet Allocation (LDA), on each month’s English news articles. On average, we process 20,000–30,000 articles’ worth of text per month to generate 15 topics (i.e., keyword distributions) for that month, that are then labelled by a human based on real-world knowledge of the month’s events.
All our NLP utilities (including the upstream tools that perform named entity recognition and quote extraction to extract gender statistics) are developed using Python and spaCy. Topic modelling, for reasons involving the sheer size of data being handled, is done using PySpark’s scalable implementation of LDA.
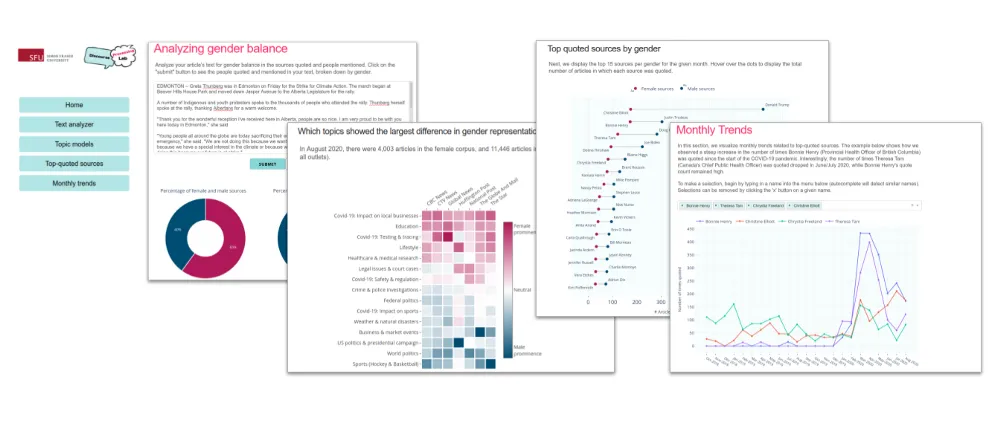
Although we do showcase our primary gender statistics (i.e., the proportion of female/male sources quoted by each outlet) on a live, interactive tracker website (hosted by Informed Opinions), we quickly realized the value of building our own custom dashboard for research and exploration purposes. The aim of our research dashboard (hosted here, on Simon Fraser University’s servers) is to provide data scientists and software developers at the Discourse Processing Lab with the means to easily extend the existing data analysis framework, and to help answer new research questions that may arise in the future.
We chose the Dash framework (by Plotly) to build our own custom interactive applications within a multi-page dashboard, all in Python. In this article, I’ll highlight some of our results, design decisions, and why Dash is a great framework for tasks related to data science research and exploration.
#visualization #gender-equality #data-science #naturallanguageprocessing #nlp