As I was going over several notebooks in Kaggle the past few days, I couldn’t help but notice some notebooks titled _“Achieving 100% accuracy on dataset_name”, “Perfect 100% accuracy using algorithm_name”, _along with various other guides on how to achieve a 100% accuracy on every dataset you would come across. While some of these notebooks did a great job at building a generalized model for the dataset and delivering pretty good results, a majority of them were just overfitting on the data.
Overfitting_ is the production of an analysis that corresponds too closely or exactly to a particular set of data, and may therefore fail to fit additional data or predict future observations reliably — _Wikipedia
And the saddest part about all this? They weren’t even realizing that they were overfitting on the dataset while trying to achieve that golden number. Most of these notebooks were found on beginner-friendly datasets like the “Iris dataset” or “Titanic dataset” and it makes sense, right? Most of us while starting on the Machine Learning trajectory was only taught one thing: “Accuracy matters”. And while this is true, it matters only up to a certain extent. This is why I’ll be discussing some other performance metrics like Confusion Matrix, Precision-Recall, and F1-Score that you should consider using along with Accuracy while evaluating a Machine Learning model. Let’s get started.
Confusion Matrix
_In the field of machine learning and specifically the problem of statistical classification, a confusion matrix, also known as an error matrix, is a specific table layout that allows visualization of the performance of an algorithm, typically a supervised learning one. — _Wikipedia
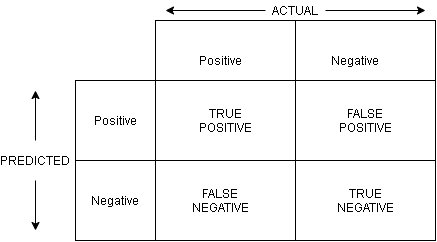
Confusion Matrix for a two-class classification problem (Image Source: Author)
To understand the confusion matrix let us consider a two-class classification problem with the two outcomes being “Positive” and “Negative”. Given a data point to predict, the model’s outcome will be any one of these two.
If we plot the predicted values against the ground truth (actual) values, we get a matrix with the following representative elements:
**True Positives (TP): **These are the data points whose actual outcomes were positive and the algorithm correctly identified it as positive.
**True Negatives (TN): **These are the data points whose actual outcomes were negative and the algorithm correctly identified it as negative.
**False Positives (FP): **These are the data points whose actual outcomes were negative but the algorithm incorrectly identified it as positive.
**False Negatives (FN): **These are the data points whose actual outcomes were positive but the algorithm incorrectly identified it as negative.
As you can guess, the goal of evaluating a model using the confusion matrix is to maximize the values of TP and TN and minimize the values of FP and FN.
#confusion-matrix #machine-learning #precision-recall #evaluation-metric #f1-score