Change is the only constant in software, and few languages change like JavaScript. One of the biggest changes we’ve seen is that JavaScript is now extremely fast.
One of the fastest JavaScript engines in existence is Google’s V8, which powers both Chrome and Node.js. In simple benchmarks, well-optimized JS (JavaScript) executed by V8 often performs at 80-90% of the speed of the corresponding C++ code.
This speed is thanks to the immense amount of work that has gone into V8’s JIT (just-in-time) compiler. The JIT compiler analyzes your code as it’s running, and optimizes the critical pieces of your code.
So if JavaScript is so fast, why are so many Node.js applications slow?
Part of the problem is that many Node.js developers lack experience profiling apps. Thankfully, there are great tools for profiling our apps built into the JS engines we use every day.
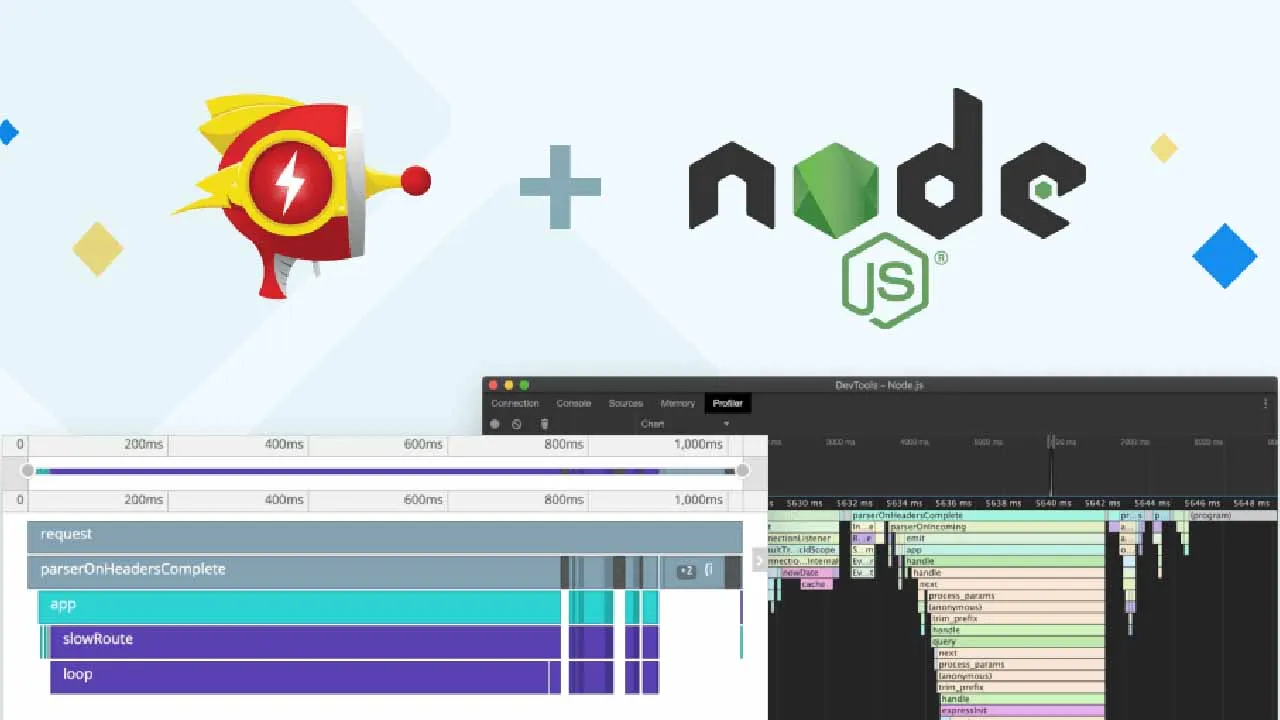
In this article, I’ll show how we can profile a Node app using both the built-in profiler and Raygun APM for Node.js. I’ll also provide some tips for optimizing the performance of Node.js applications.
Using Node’s built-in profiler
Node has a high-quality profiler built into the Node debugger. We can enable it by passing the --inspect flag when running an application.
Here is a sample application we can use to test out the Node.js profiler. It includes both a fast route that only sends a response and a slow route that loops, allocates, and sleeps.
If you want to follow along yourself, you will need Node.js (v12+) installed, as well as Chrome/Chromium.
#node #node.js
