Performance metrics are used to evaluate the overall performance of Machine learning algorithms and to understand how well our machine learning models are performing on a given data under different scenarios. Choosing the right metric is very essential to understand the behavior of our model and make necessary changes to further improve the model. There are different types of performance metrics. In this article, we’ll have a look at some of the most used metrics.
Confusion Matrix.
A confusion matrix is used to evaluate the performance of classification algorithms.
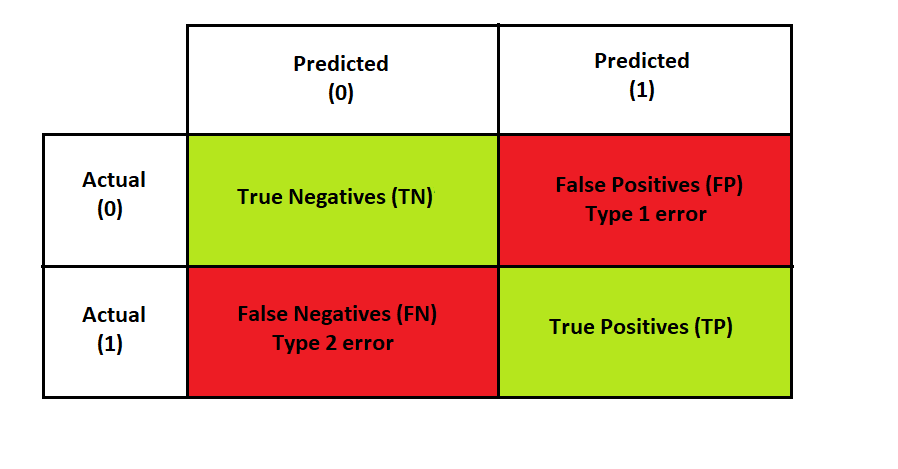
Confusion Matrix
As we can see from the image above, a confusion matrix has two rows and two columns for binary classification. The number of rows and columns of a confusion matrix is equal to the number of classes. Columns are the predicted classes, and rows are the actual classes.
Now let’s look at each block of our confusion matrix:
1) True Positives (TP): In this case, the actual value is 1 and the value predicted by our classifier is also 1
2) True Negatives (TN): In this case, the actual value is 0 and the value predicted by our classifier is also 0
2) False Positives (FP) (Type 1 error): In this case, the actual value is 0 but the value predicted by our classifier is 1
3) **False Negatives (FN) (Type 2 error): **In this case, the actual value is 1 but the value predicted by our classifier is 0
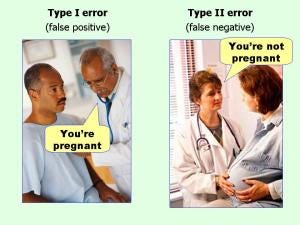
Source of Image: Effect Size FAQs by Paul Ellis
The end goal of our classification algorithm is to maximize the true positives and true negatives i.e. correct predictions and minimize the false positives and false negatives i.e. incorrect predictions.
False negatives can be worrisome especially in medical applications e.g., Consider an application where you have to detect breast cancer in patients. Suppose a patient has cancer but our model predicted that she doesn’t have cancer. This can be dangerous as the person is cancer positive but our model failed to predict it.
Accuracy.
Accuracy is the most commonly used performance metric for classification algorithms. Accuracy can be defined as the number of correct predictions divided by Total predictions. We can easily calculate accuracy from the confusion matrix using the below formula.

Accuracy works well when the classes are balanced i.e. equal number of samples for each class, but if the classes are imbalanced i.e. unequal number of samples per class, then accuracy might not be the right metric.
Why is accuracy an unreliable metric for imbalanced data?
let’s consider a binary classification problem where we have two classes of cats and dogs, where cats consist of 90% of the total population and dogs consist of 10%. Here cat is our majority class and the dog is our minority class. now if our model predicts every data point as cats still we can get a very high accuracy of 90%.
This can be worrisome especially when the cost of misclassification of minority class is very high e.g., in applications such as fraud detection in credit card transactions, where the fraudulent transactions are very less in number compared to non-fraudulent transactions.
Recall or sensitivity.
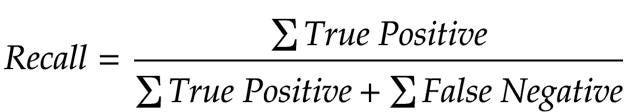
Recall can be defined as the number of correct positive predictions divided by the sum of correct positive predictions and incorrect positive predictions, it is also called a true positive rate. The recall value ranges from 0 to 1.
Recall can be calculated from the confusion matrix using the below formula. The recall metric is used when the classes are imbalanced.
Recall answers the following question:- Out of all the actual positive class samples how many did we correctly predict as positive and how many should have been predicted as positive but were incorrectly predicted as negative?
Recall is all about minimizing the False Negatives or Type 2 error, so when our objective is to minimize false negatives we choose recall as a metric.
Why is recall a good metric for imbalanced data?
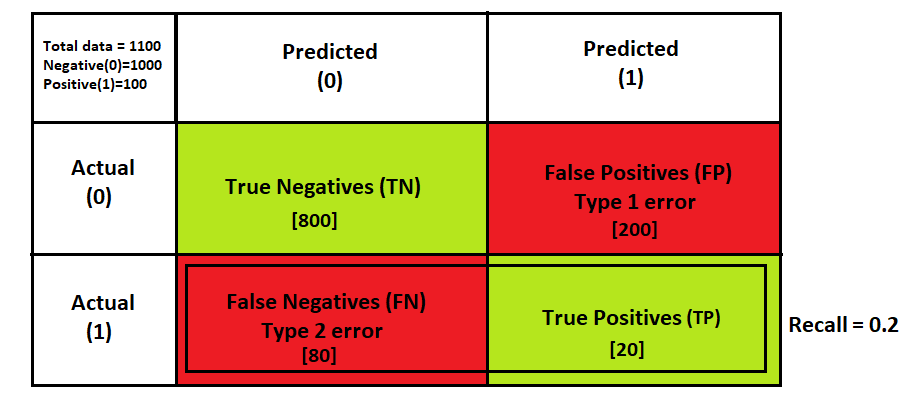
let’s consider the example of an imbalanced dataset from the confusion matrix above, there are 1100 total samples in the dataset out of which 91% samples belong to the negative class, the TP, TN, FP, FN values are
True positive = 20
True Negative=800
False-positive = 200
False Negative=80
now if we put these values in our recall formula we get recall = 0.2, this means that out of all the actual positive class samples only 20% were correctly predicted as positive and 80% samples should have been predicted as positive but were incorrectly predicted as negative.
Here, we can see that despite getting a high accuracy of 74.5% the recall score is very low as the number of false negatives is more than the number of true positives.
#performance-metrics #data-science #deep-learning #artificial-intelligence #machine-learning #deep learning