In this article, we will analyze a simple T-SQL query execution plan with different aspects. This will help us to improve our practical skills instead of discussing theoretical knowledge.
The execution plan is a very significant point to figure out what is going on behind the query execution process. For this reason, if we want to boost the performance of a query in which we experience poor performance, we need to understand clearly what this guide tells us. In fact, execution plans are an output of the query optimizer, so we’ll try to understand how the query optimizer behaves. Firstly, let’s go over some of the main concepts that will be used in this article.
What is Transact-SQL (T-SQL)?
SQL stands for Structured Query Language and is designed to query the database system, and it is also compliant with the ANSI standard. However, **Transact-SQL (T-SQL) **is an advanced form of the SQL language that is particularly used to query Microsoft SQL databases.
What is a query optimizer?
The query optimizer is a very crucial component of the database engine that analyzes queries and tries to generate effective (optimal) execution plans. Every executed query will consume resources, such as I/O, CPU, Memory. The optimizer calculates the estimated cost of these resources and chooses an optimum query plan based on this calculation.
What is an Execution Plan?
The execution plan can be thought of as a flight data recorder that tells us the execution details of a query. The actual execution plan generated after a query includes detailed information about the runtime metrics. On the other hand, a query optimizer can create a query plan based on the estimation method, and this query plan is called an Estimated Execution Plan.
How to display an execution plan?
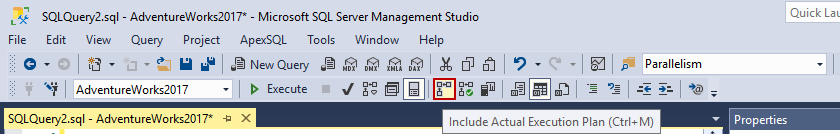
We can enable the Actual Execution Plan of a query on the SQL Server Management Studio (SSMS) toolbar. Only we need to click the Include Actual Execution Plan button, as shown below, or we can press the Ctrl+M key combination at the same time.
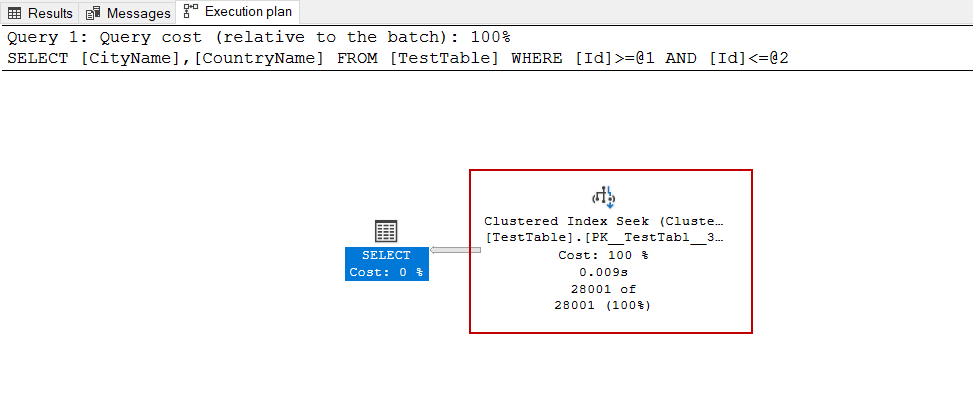
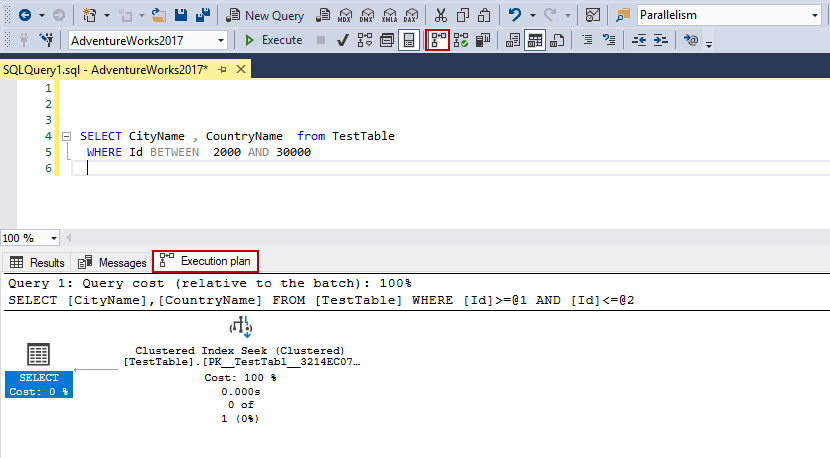
After the execution of the query, we can see the actual execution plan.
#execution plans #performance #t-sql #sql