Motivation
Have you ever wanted to share your interactive Python chart on social media platforms such as Medium, Reddit, or your own blog but ended up having to take photos or record videos or gifs of the charts? Alternatively, many people end up using a non-code solution, like Mapbox or Flourish, even though they’d rather build their visualizations in Python using libraries like Pandas, Altair, Bokeh, Folium, and Plotly.
I like to use charts to demonstrate my results on Medium’s articles but found it challenging to embed my interactive charts until I discovered Datapane. With Datapane, I can embed my charts in two lines of code.
What is Datapane?
Datapane is an API for people who analyze data in Python and need a way to share their results. Datapane makes it easy for data analysts or data scientists to generate reports from components such as plot, markdown, dataframe and publish on the web to send others. If you don’t know about Datapane, I wrote a short article introducing to Datapane
Introduction to Datapane: A Python Library to Build Interactive Reports
Simple Framework to Create Beautiful Reports and Share your Analysis Results with your Team
Besides its ease to create a report and deploy a script, Datapane also makes it easy to embed your charts or table.
Embed in Medium
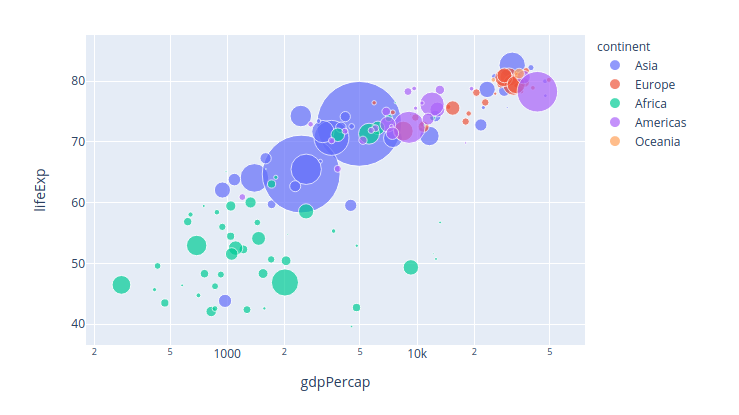
Let’s say you created an interactive Plotly bubble chart with this code:
Using Datapane’s API, you can publish this Plotly chart to the web and embed it into Medium.
Firstly, install Datapane using pip:
pip3 install datapane
Then simply sign-up to Datapane to get your API token. Copy and use it to login through the Datapane CLI:
datapane login --token=[your_secret_token]
Once you have logged in, you can use the Datapane API to publish your plots.
Import Datapane into your script, and publish a new Report with a single Plot component in it.
In the example, we are also telling Datapane to set the visibility of our report to public, so anyone will the URL will be able to access it.
When you run this Python code, Datapane will upload your Plotly chart using the API and give you a URL which you can share!
https://datapane.com/khuyentran1401/reports/bubble_c7ac0e14/
Next, copy this link into your Medium post in Edit Mode, and — voila! — an embedded chart is automatically created for you inside your Medium post.
#plotly #data-visualisation #data-visualization #data-science #data-analysis
