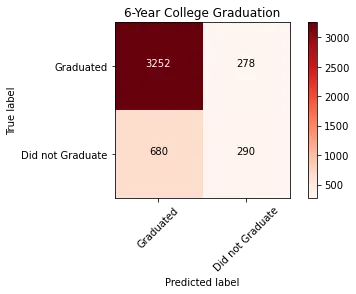
In creating a classification model, it is important to evaluate how well a model can predict or identify actual outcomes. For supervised classification models, there are a few standard methods for model evaluation to inform model improvement — they are:
- Accuracy
- Precision
- Recall
- Specificity
- F1 Score
- AUC
Below, I describe each evaluation metric and provide a binary classification example to facilitate comprehension.
Confusion Matrix
True positives: The top left corner shows the number of correct positive predictions that the model made. In this example, the model accurately predicted that 3,253 students would graduate from college within six years of enrollment.
_True Positive Rate: _TP/(TP + FN)
False Negatives (also known as Type II Error): The top right corner of the matrix shows the number of incorrect negative predictions that the model made. In this example, the model predicted that these students would not graduate within six years of enrollment, but they actually did.
False Negative Rate: FN/(FN + TP)
#statistics #evaluation #social-science #machine-learning #predictive-analytics
