Disadvantages of k-means clustering
The essence of the K-means clustering algorithm is that it
- Takes the center of each cluster as the center of the circle
- Draws a circle with the maximum Euclidean distance from the center point of the cluster to the center point of the cluster as the radius.
This roundness truncates the training set. Moreover, k-means requires that the shape of these clusters must be circular. Therefore, the clusters (circles) fitted by the k-means model are very different from the actual data distribution (maybe ellipses)
As result multiple circular clusters are mixed together and overlap each other
In general, k-means has two shortcomings, which makes it unsatisfactory for many data sets (especially low-dimensional data sets):
- The shape of the class is not flexible enough, the fitting result is quite different from the actual one, and the accuracy is limited.
- The probability that the sample belongs to each cluster is qualitative. Only if it is true or not, the probability value cannot be output. The application lacks robustness.

Well, if you are completely unaware of Clustering, it’s a need, types, and applications then I recommend you go through this article first.
Clustering Clearly Explained
Gaussian or Normal Distribution
Let’s try to understand what is the “Gaussian” in Gaussian Mixture Model

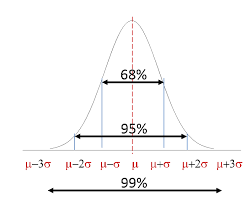
The gaussian distribution also known as the Normal **distribution **is a very important probability distribution in the various fields and has a significant influence on many aspects of statistics.
If the random variable X follows a Gaussian distribution with mathematical expectation μ and standard deviation σ2, it is written as

Then its probability density function is

- The expected value of the normal distribution μ determines its position
- Its standard deviation σ determines the amplitude of the distribution.
- Because its curve is bell-shaped, people often call it a bell-shaped curve. What we usually call the standard normal distribution is the normal distribution with μ = 0 and σ = 1.
Everything that goes up, comes down, according to Gauss.
Single Gaussian Model
When the sample data X is one-dimensional data (Univariate), the Gaussian distribution follows the following probability density function (PDF)

Wherein **μ **the data mean (desired), **σ **a data standard deviation.
When the sample data X is Multivariate, the Gaussian distribution follows the probability density function below:

Among them, **μ **is the data mean (expected), **σ **is the Covariance, D is the data dimension.
Gaussian Mixture Model
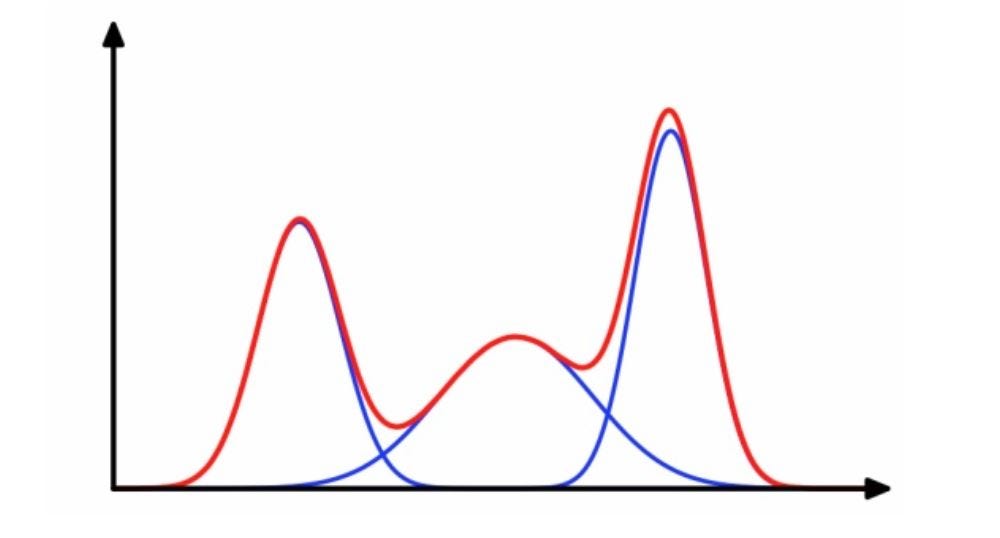
The Gaussian mixture model can be regarded as a model composed of K single Gaussian models. These K submodels are the hidden variables of the hybrid model
The Gaussian mixture model (GMM) can be regarded as an optimization of the k-means model. It is not only a commonly used in industry but also a generative model.
The Gaussian mixture model attempts to find a mixed representation of the probability distribution of the multidimensional Gaussian model, thereby fitting a data distribution of arbitrary shape.
#gaussian-mixture-model #data-science #clustering #data analysis
