In this post, you’ll see getting all your standard data analysis done in less than 30 seconds with just 1 line of Python. The wonders of Pandas Profiling.
The vanilla pandas way (the boring way)

Anyone working with data in Python will be familiar with the pandas package. If you’re not, pandas is the go-to package for most rows-&-columns formatted data. If you don’t have pandas make sure to install it using pip install in your terminal:
pip install pandas
Now, let’s see what the default methods can do for us:

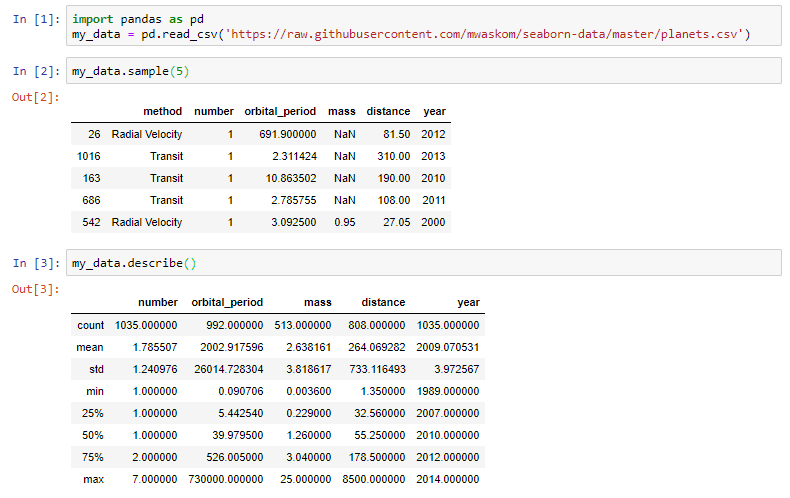
Pretty decent, but also bland… And where did the “method” column go?
For those unaware of what’s happening above:
Any pandas DataFrame has a .describe()method which returns the output above. However, unnoticed in this method are categorical variables. In our example above the “method” column is completely omitted from the output.
Let’s see if we can do any better. (hint: we can!)
Pandas Profiling (the fancy way)

This is just the beginning of the report.
How would you like it if I told you I could produce the following statistics with just 3 lines of Python…? Actually just 1 line if we don’t count our imports.
- Essentials: type, unique values, missing values
- Quantile statistics like minimum value, Q1, median, Q3, maximum, range, interquartile range
- Descriptive statistics like mean, mode, standard deviation, sum, median absolute deviation, coefficient of variation, kurtosis, skewness
- Most frequent values
- Histogram
- Correlations highlighting of highly correlated variables, Spearman, Pearson and Kendall matrices
- Missing values matrix, count, heatmap and dendrogram of missing values
(List of features are directly from the Pandas Profiling GitHub)
Well we can using the Pandas Profiling package! To install the Pandas Profiling package simply use pip install in your terminal:
pip install pandas_profiling
Seasoned data analysts might scoff at this at first glance for being fluffy and flashy, but it can definitely be useful for getting a quick first-hand impression of your data:

See, 1 line, just as I promised! #noclickbait
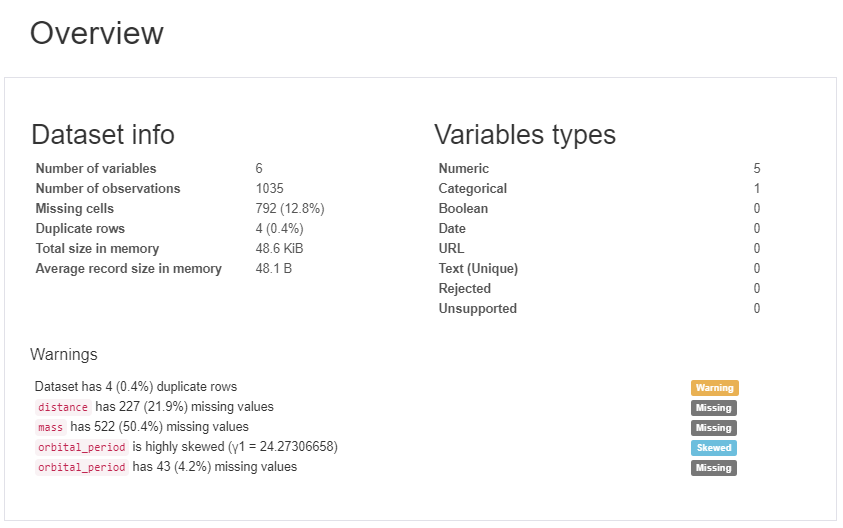
The first thing you’ll see it the Overview (see the picture above) which gives you some very high-level statistics on your data and variables as well as warnings like high correlation between variables, high skewness and more.
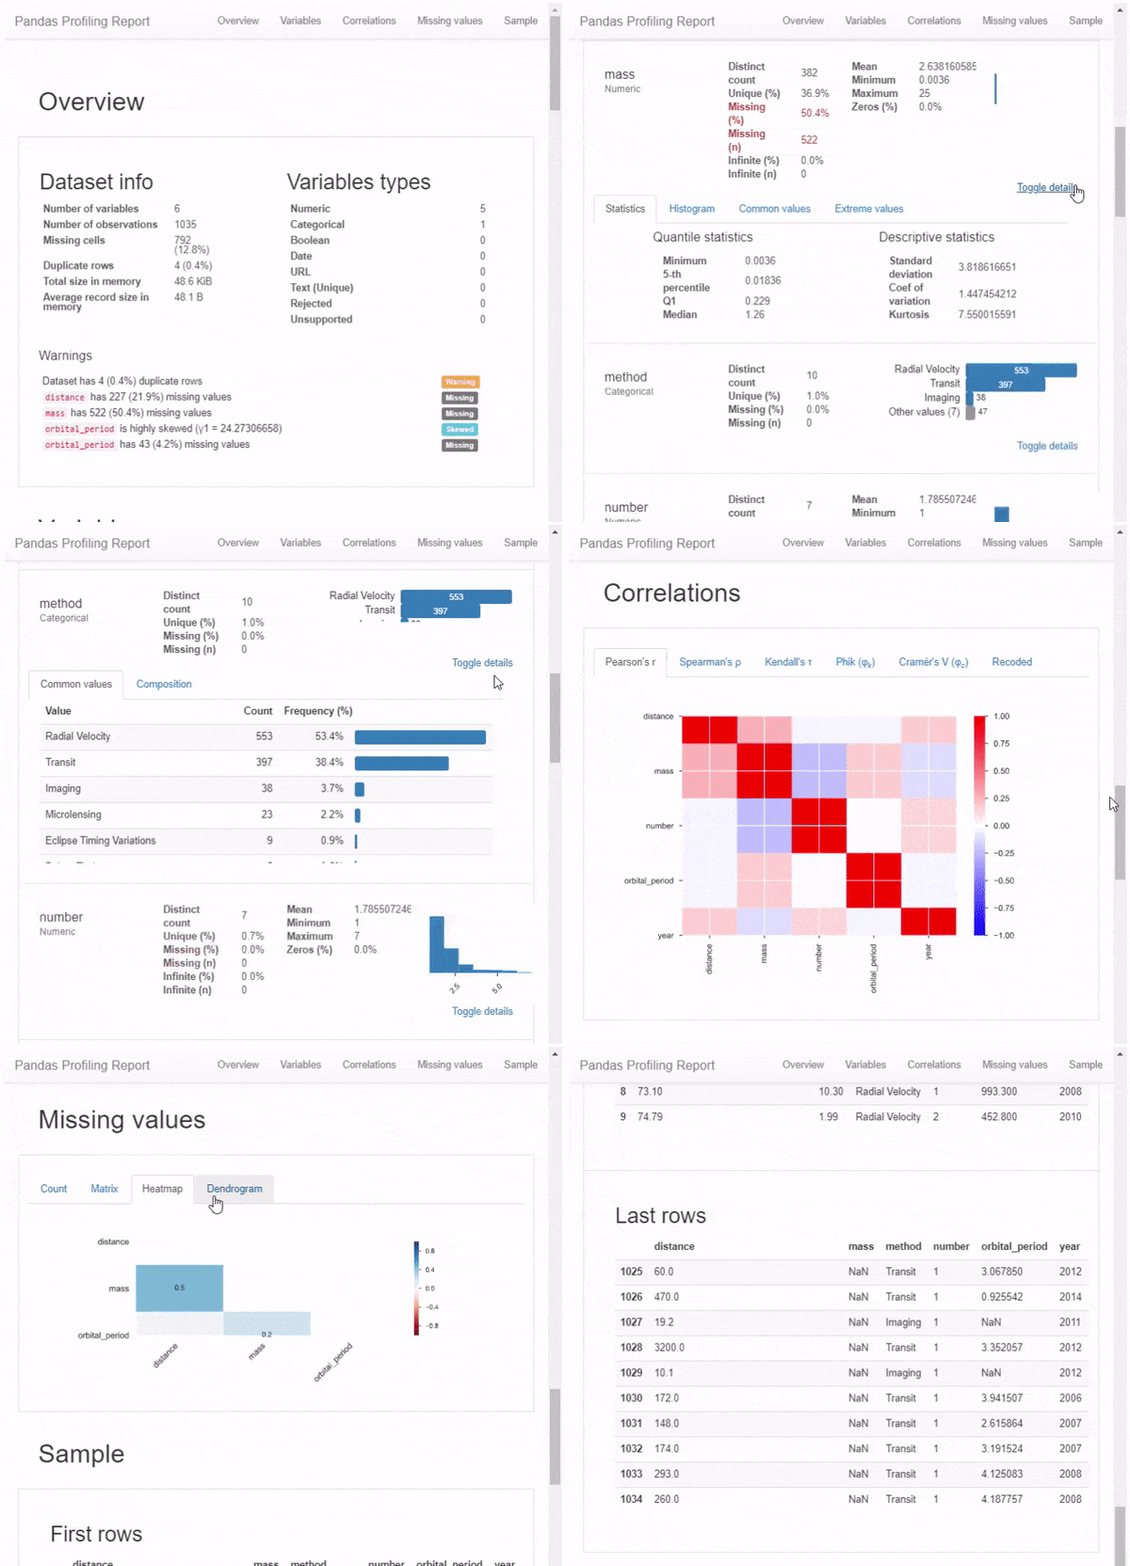
But this isn’t even close to everything. Scrolling down we find that there are multiple parts to the report, but simply showing the output of this 1-liner with pictures wouldn’t do it any justice, so I’ve made a GIF instead:

I highly recommend you to explore the features of this package yourself, after all, it’s just one line of code and you might find it useful in your future data analysis.
import pandas as pd
import pandas_profiling
pd.read_csv('https://raw.githubusercontent.com/mwaskom/seaborn-data/master/planets.csv').profile_report()
Closing thoughts
This was just a really quick and short one. I just discovered Pandas Profiling myself and thought I would share!
#python #pandas #machine-learning #data-science #data-analysis
