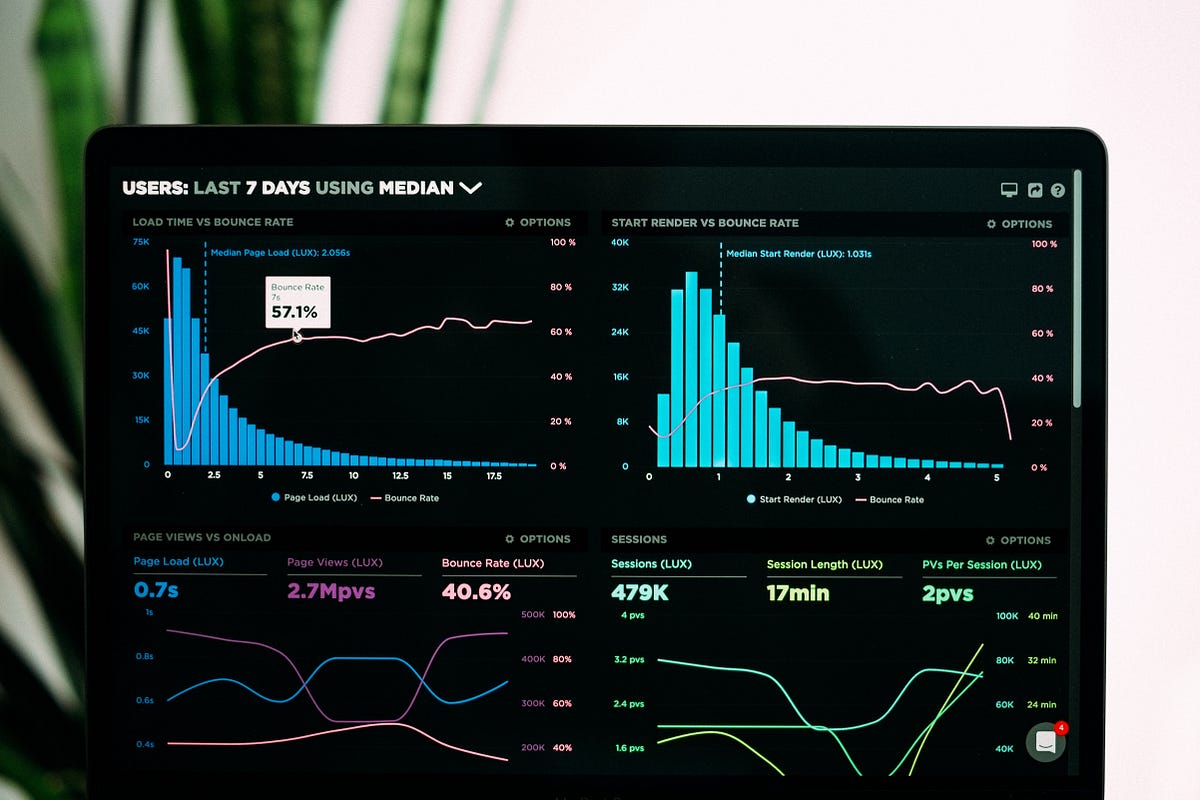
Visualization is an important skill set for a data scientist. A good visualization can help in clearly communicating insights identified in the analysis also it is a good technique to better understand the dataset. Our brain is wired in a way that makes it easy for us to extract patterns or trends from visual data as compared to extracting details based on reading or other means.
In this article, I will be covering the visualization concept from the basics using python. Below are the steps to learn visualization from basic,
- Step 1: Importing data
- Step 2: Basic visualization using Matplotlib
- Step 3: More advanced visualizations, still using Matplotlib
- Step 4: Building quick visualizations for data analysis using Seaborn
- Step 5: Building interactive charts
By the end of this journey, you would be equipped with everything that is required to build a visualization. Though we will be not covering every single visualization that can be built you will be learning the concepts behind building a chart and hence it would be easy for you to build any new charts that are not covered in this article.
#data-science #python #visualization
