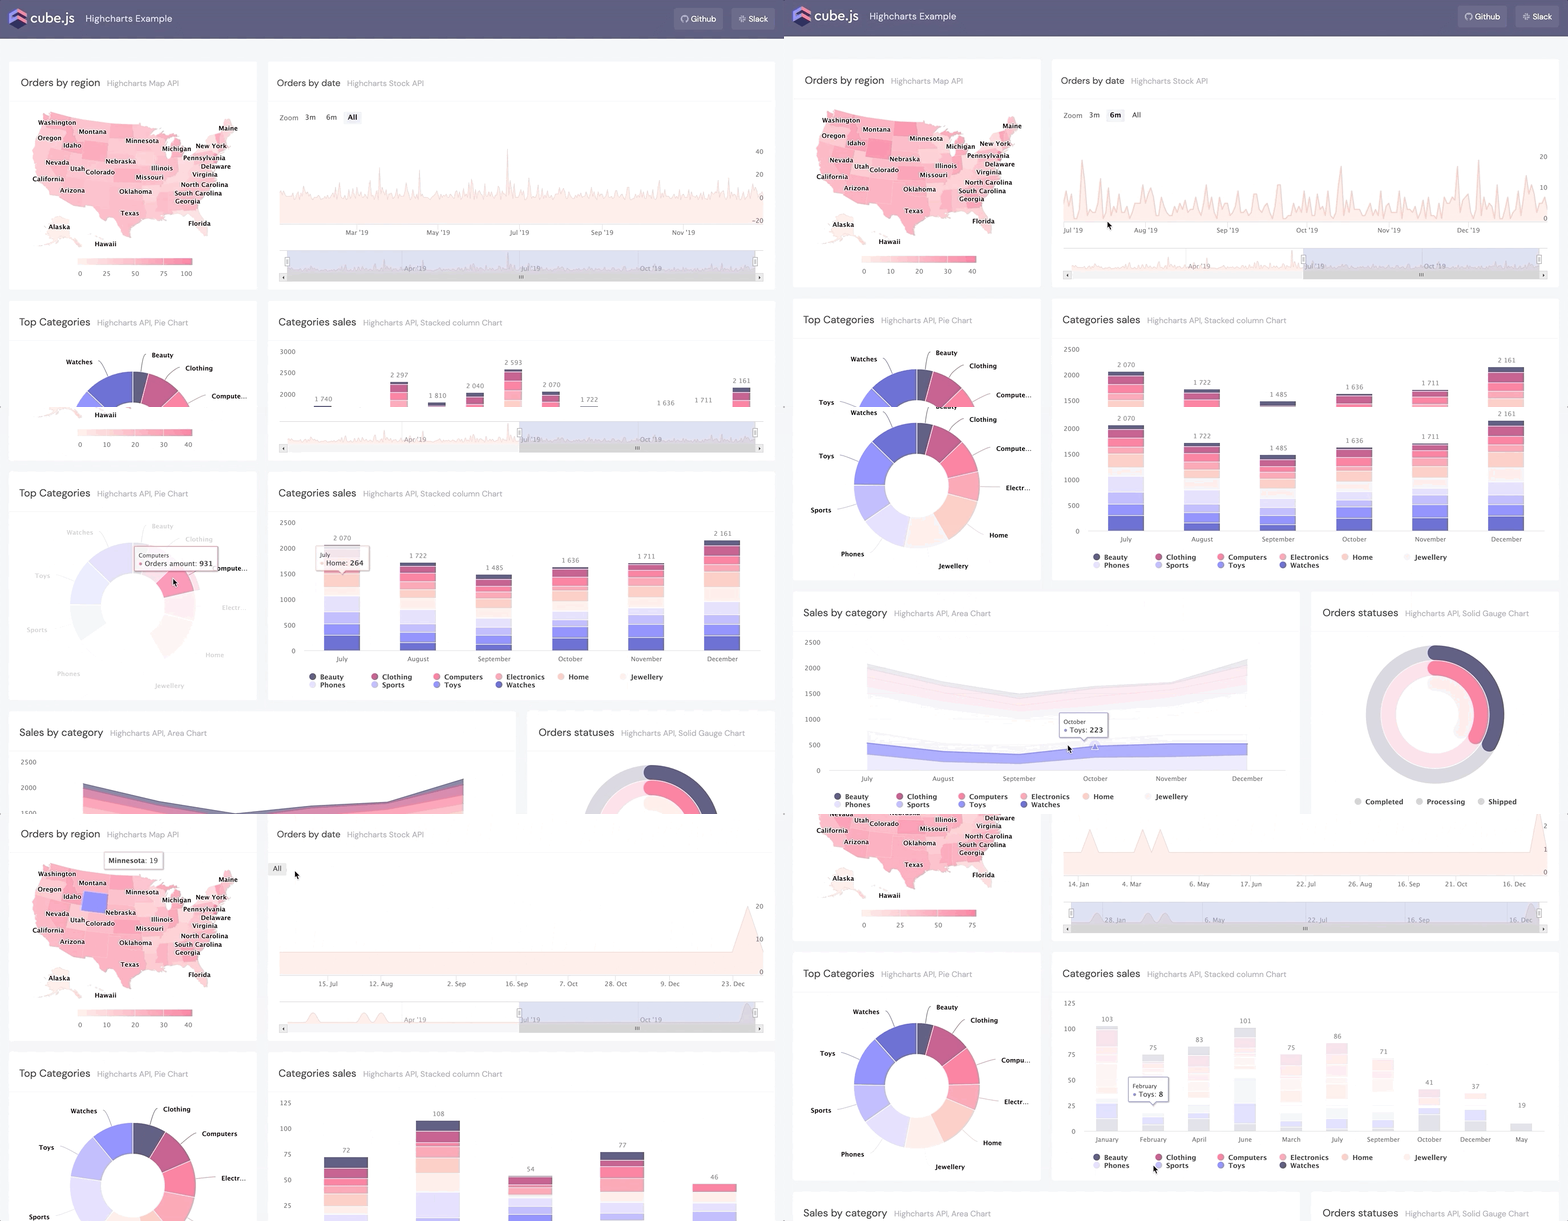
Started as a simple charting tool for monitoring a snow depth near the owner’s country house in Norway, Highcharts quickly became one of the most popular visualization libraries. It provides a lot of great built-in interactive features and is easy to use.In this tutorial we are going to build a simple e-commerce dashboard with Cube.js and Highcharts. We’ll use the main Highcharts library, as well as Maps, Stock, and Solid Gauge modules.
Please keep in mind that Highcharts libraries are available under different licenses, depending on whether it is intended for commercial/government use, or for personal or non-profit projects. Make sure to check its license page.
Below, you can see the demo of the dashboard that we’re going to build.

You can find a live demo here and the source code is available on Github.
To implement this example, we’ll need:
- Database (we will use PostgreSQL) with sample data
- Cube.js backend to handle communications between our database and the frontend
- The frontend application (we will build one with React)
#react #javascript #web-development #tutorial #programming #software-development #frontend #frontend-development
