Chart.xkcd: xkcd, Hand-Drawn-Style Charts
Originally published at https://github.com
This repo is in its early stage, lots of bugs need to be fixed and new charts will be added. Watch this repo to be notified of new versions
About
Chart.xkcd is a chart library plots “sketchy”, “cartoony” or “hand-drawn” styled charts.
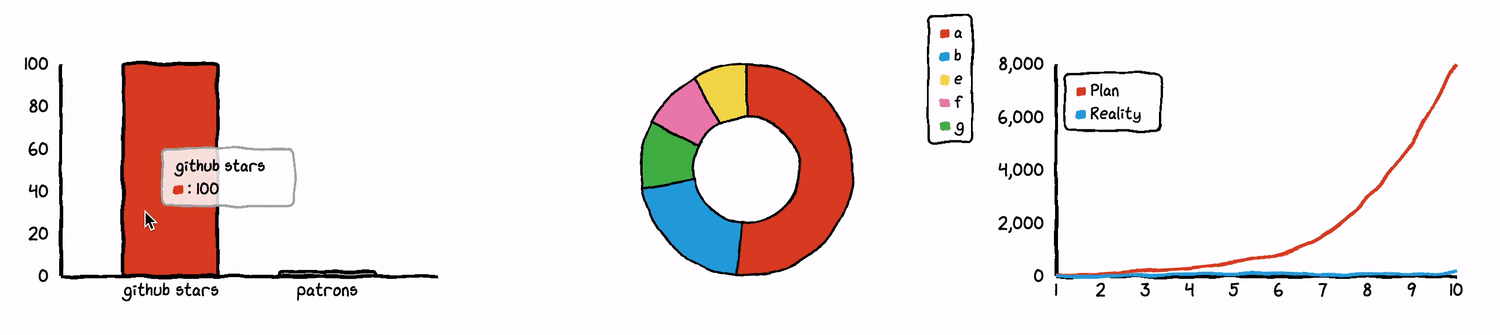
Check out the documentation for more instructions and links, or try out the examples
Quick start
It’s easy to get started with chart.xkcd. All that’s required is the script included in your page along with a single <svg> node to render the chart.
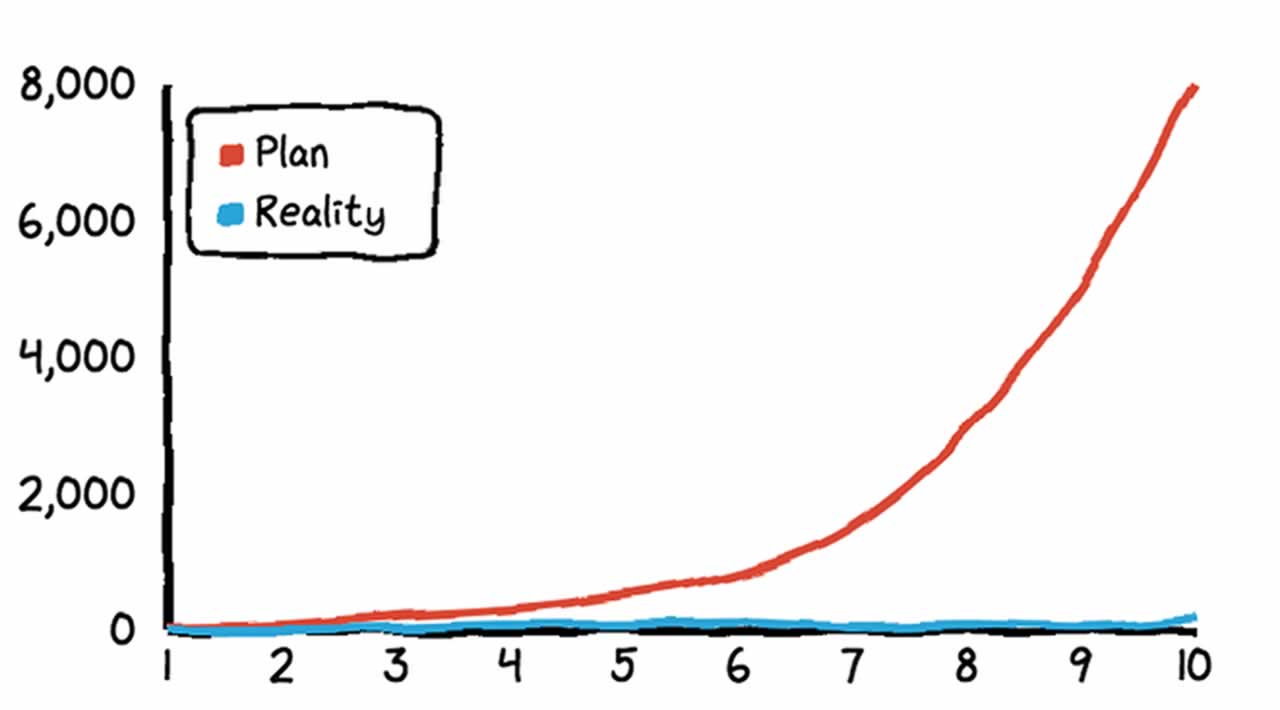
In the following example we create a line chart.
Preview and edit on codepen
<svg class="line-chart"></svg>
<script src="https://cdn.jsdelivr.net/npm/chart.xkcd@1/dist/chart.xkcd.min.js"></script>
<script>
  const svg = document.querySelector('.line-chart')
new chartXkcd.Line(svg, {

title: ‘Monthly income of an indie developer’,

xLabel: ‘Month’,

yLabel: ‘$ Dollors’,

data: {

labels:[‘1’, ‘2’, ‘3’, ‘4’, ‘5’, ‘6’,‘7’, ‘8’, ‘9’, ‘10’],

datasets: [{

label: ‘Plan’,

data: [30, 70, 200, 300, 500 ,800, 1500, 2900, 5000, 8000],

}, {

label: ‘Reality’,

data: [0, 1, 30, 70, 80, 100, 50, 80, 40, 150],

}]

},

});

</script>
Thanks for reading ❤
If you liked this post, share it with all of your programming buddies!
Follow us on Facebook | Twitter
Further reading
☞ NodeJS - The Complete Guide (incl. MVC, REST APIs, GraphQL)
☞ GraphQL with React: The Complete Developers Guide
☞ How to create a simple CRUD App using GraphQL and Node.js
☞ A Beginner’s Guide to GraphQL
☞ Node, Express, PostgreSQL, Vue 2 and GraphQL CRUD Web App
☞ Developing and Securing GraphQL APIs with Laravel
#graphql #database #web-development