Matplotlib Cheatsheets: A Comprehensive Guide
This article provides a collection of cheatsheets for Matplotlib users. These cheatsheets cover a wide range of topics, including basic plotting, advanced plotting, and customization. They are designed to be easy to use and reference, so you can quickly find the information you need to create beautiful and informative data visualizations.
Matplotlib is a popular Python library for data visualization. It offers a wide range of features for creating plots, charts, and graphs. However, Matplotlib can be complex to learn, especially for beginners.
Cheatsheets
| Cheatsheet (download pdf) | |
|---|---|
 |  |
Handouts
| Beginner handout (download pdf) | Intermediate handout (download pdf) | Tips handout (download pdf) |
|---|---|---|
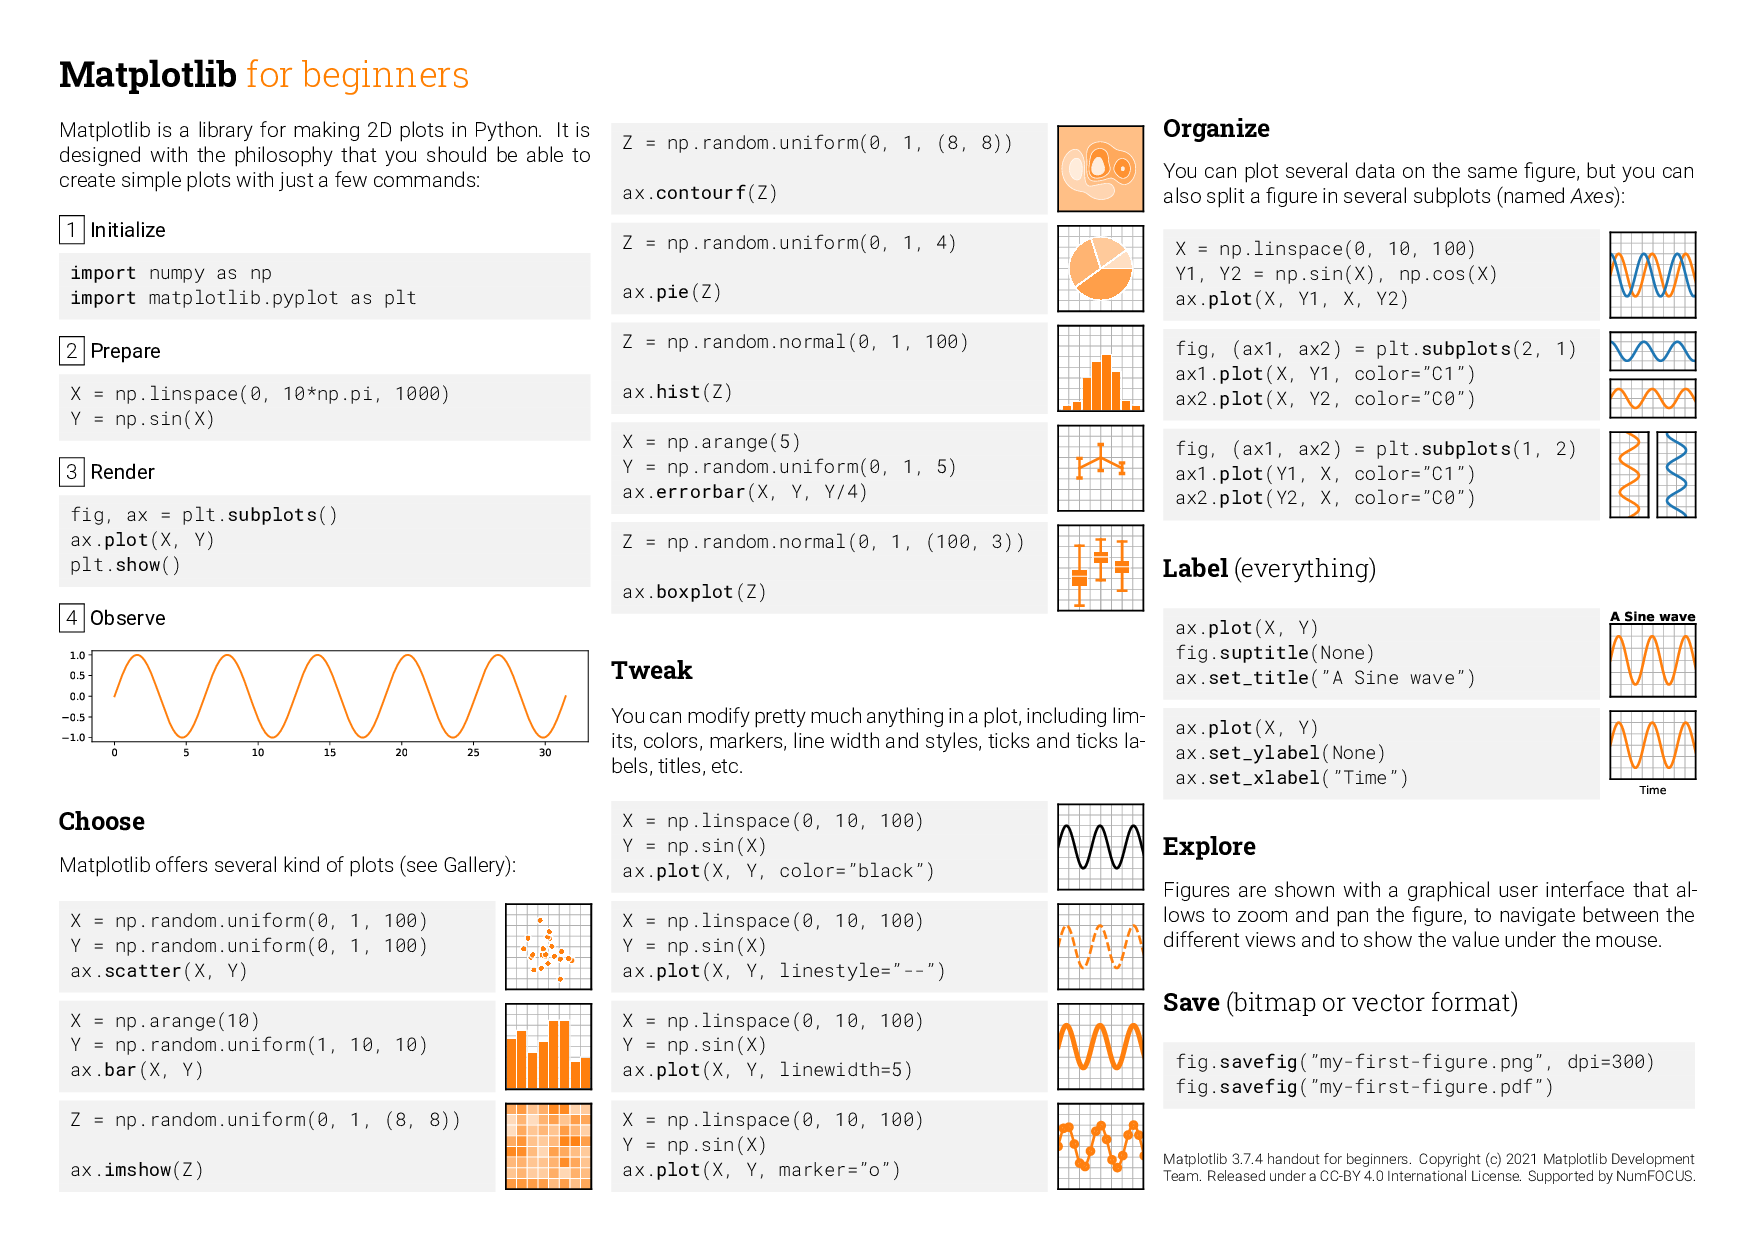 | 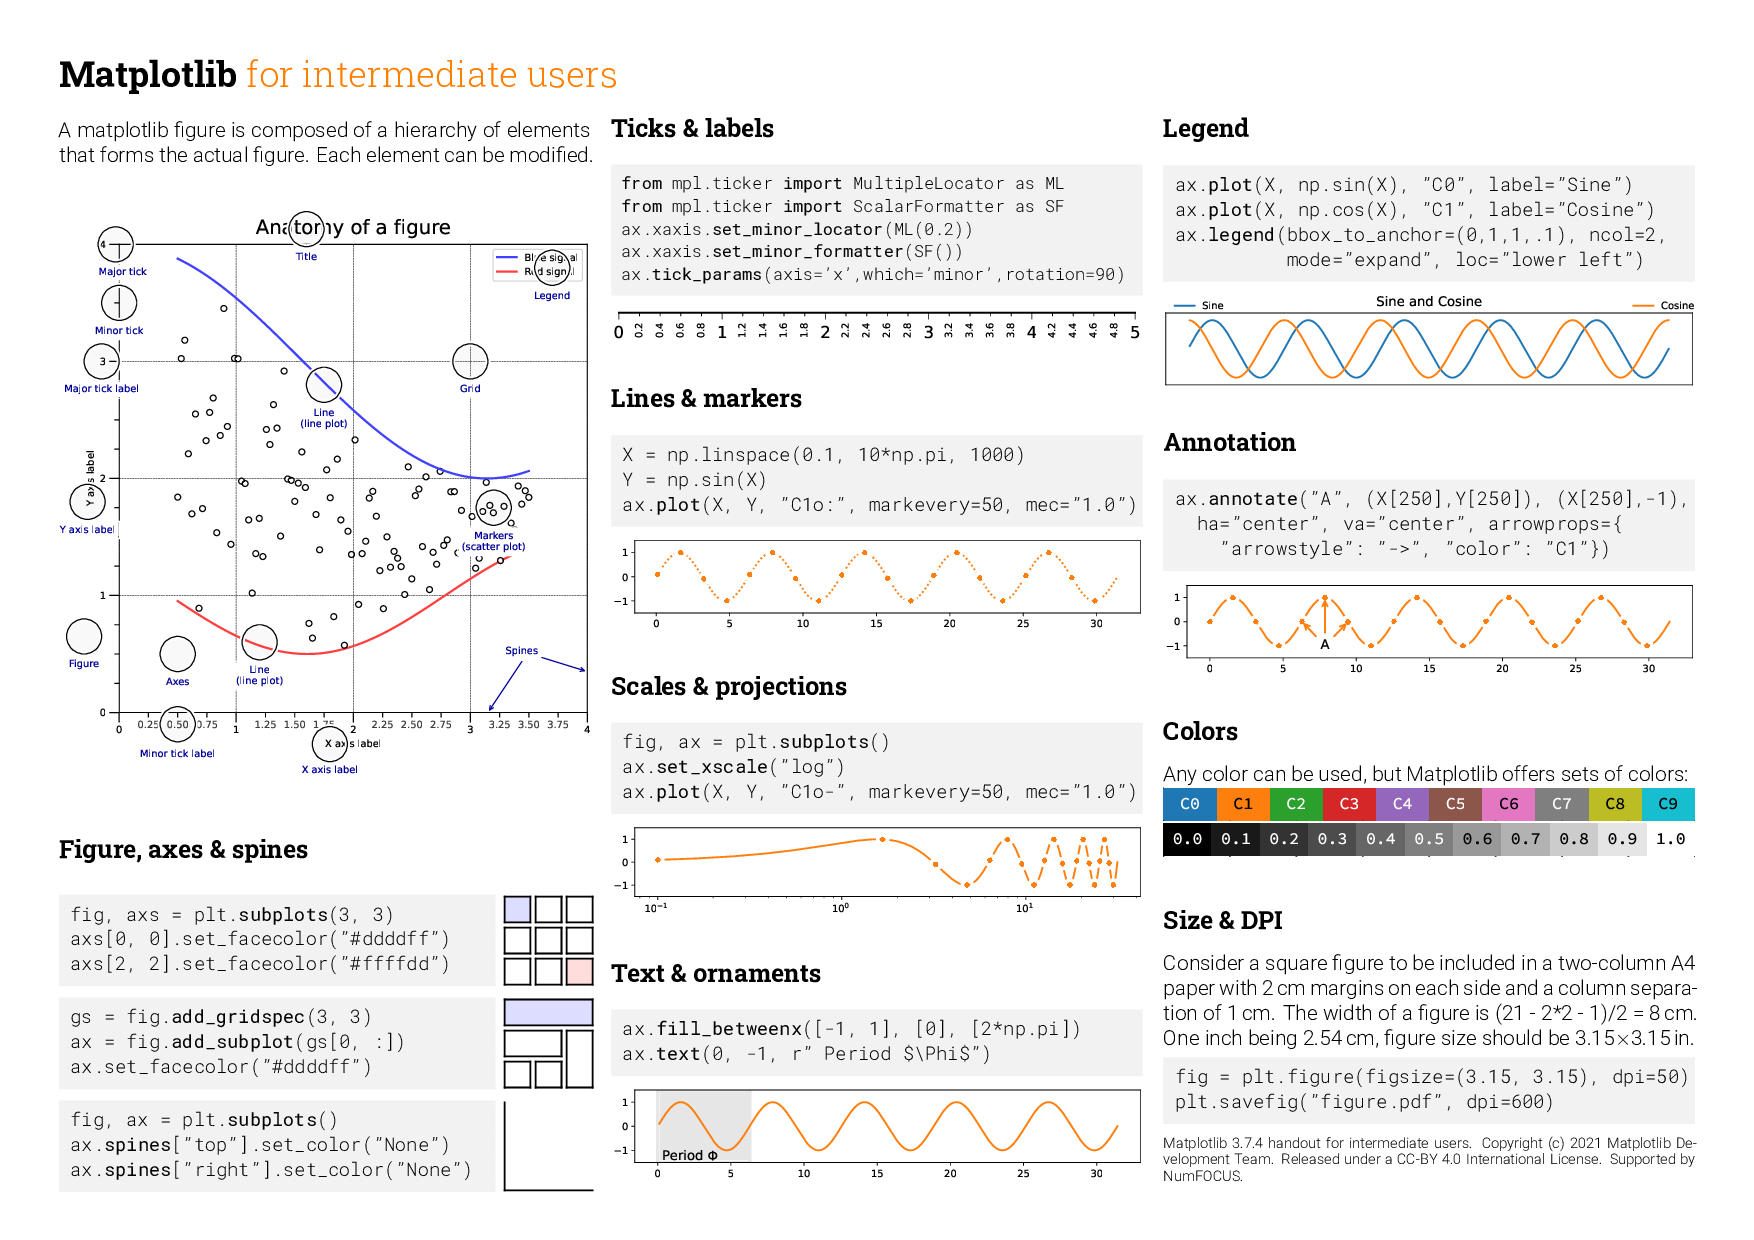 |  |
For contributors to the cheatsheets
How to compile
- You need to create a
fontsrepository with:
fonts/roboto/*: See https://fonts.google.com/specimen/Roboto or https://github.com/googlefonts/roboto/tree/master/src/hintedfonts/roboto-slab/*: See https://fonts.google.com/specimen/Roboto+Slab or https://github.com/googlefonts/robotoslab/tree/master/fonts/staticfonts/source-code-pro/*: See https://fonts.google.com/specimen/Source+Code+Pro or https://github.com/adobe-fonts/source-code-pro/tree/release/OTFfonts/source-sans-pro/*: See https://fonts.google.com/specimen/Source+Sans+Pro or https://github.com/adobe-fonts/source-sans-pro/tree/release/OTFfonts/source-serif-pro/*: See https://fonts.google.com/specimen/Source+Serif+Pro or https://github.com/adobe-fonts/source-serif-pro/tree/release/OTFfonts/eb-garamond/*: See https://bitbucket.org/georgd/eb-garamond/src/masterfonts/pacifico/*: See https://fonts.google.com/download?family=Pacifico
On Linux, with make installed, the fonts can be set up with the following command:
make -C fonts
The fonts can be made discoverable by matplotlib (through fontconfig) by creating the following in $HOME/.config/fontconfig/fonts.conf (see here):
<?xml version="1.0"?>
<!DOCTYPE fontconfig SYSTEM "fonts.dtd">
<fontconfig>
<dir>/path/to/cheatsheets/fonts/</dir>
...
</fontconfig>
- You need to generate all the figures:
$ cd scripts
$ for script in *.py; do python $script; done
$ cd ..
- Compile the sheet
$ xelatex cheatsheets.tex
$ xelatex cheatsheets.tex
#matplotlib #python #datavisualizations