Context
I have been working in Advertising, specifically Digital Media and Performance, for nearly 3 years and customer behaviour analysis is one of the core concentrations in my day-to-day job. With the help of different analytics platforms (e.g. Google Analytics, Adobe Analytics), my life has been made easier than before since these platforms come with the built-in function of segmentation that analyses user behaviours across dimensions and metrics.
However, despite the convenience provided, I was hoping to leverage Machine Learning to do customer segmentation that can be scalable and applicable to other optimizations in Data Science (e.g. A/B Testing). Then, I came across the dataset provided by Google Analytics for a Kaggle competition and decided to use it for this project.
Feel free to check out the dataset here if you’re keen! Beware that the dataset has several sub-datasets and each has more than 900k rows!
A. Explanatory Data Analysis (EDA)
This always remain an essential step in every Data Science project to ensure the dataset is clean and properly pre-processed to be used for modelling.
First of all, let’s import all the necessary libraries and read the csv file:
import pandas as pd
import matplotlib.pyplot as plt
import numpy as np
import seaborn as sns
df_raw = pd.read_csv("google-analytics.csv")
df_raw.head()
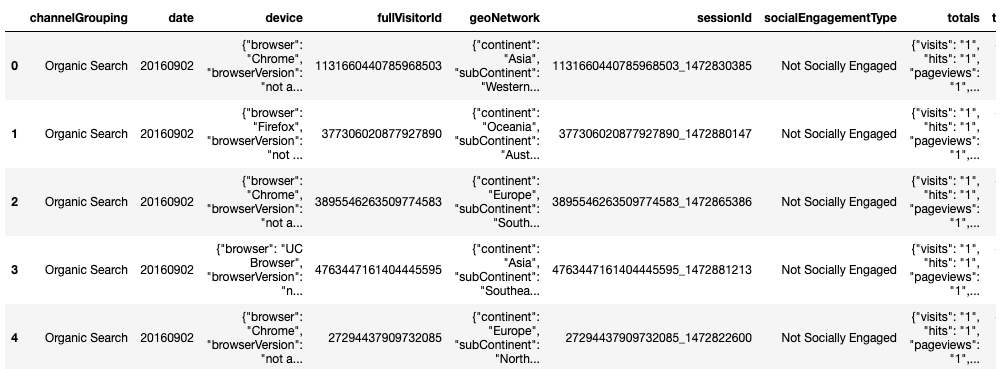
1. Flatten JSON Fields
As you can see, the raw dataset above is a bit “messy” and not digestible at all since some variables are formatted as JSON fields which compress different values of different sub-variables into one field. For example, for geoNetwork variable, we can tell that there are several sub-variables such as continent, subContinent, etc. that are grouped together.
Thanks to the help of a Kaggler, I was able to convert these variables to a more digestible ones by flattening those JSON fields:
import os
import json
from pandas import json_normalize

def load_df(csv_path="google-analytics.csv", nrows=None):
    json_columns = ['device', 'geoNetwork', 'totals', 'trafficSource']
    df = pd.read_csv(csv_path, converters={column: json.loads for column in json_columns},dtype={'fullVisitorID':'str'}, nrows=nrows)
    for column in json_columns:
        column_converted = json_normalize(df[column])
        column_converted.columns = [f"{column}_{subcolumn}" for subcolumn in column_converted.columns]
        df = df.drop(column, axis=1).merge(column_converted, right_index=True, left_index=True)
    return df
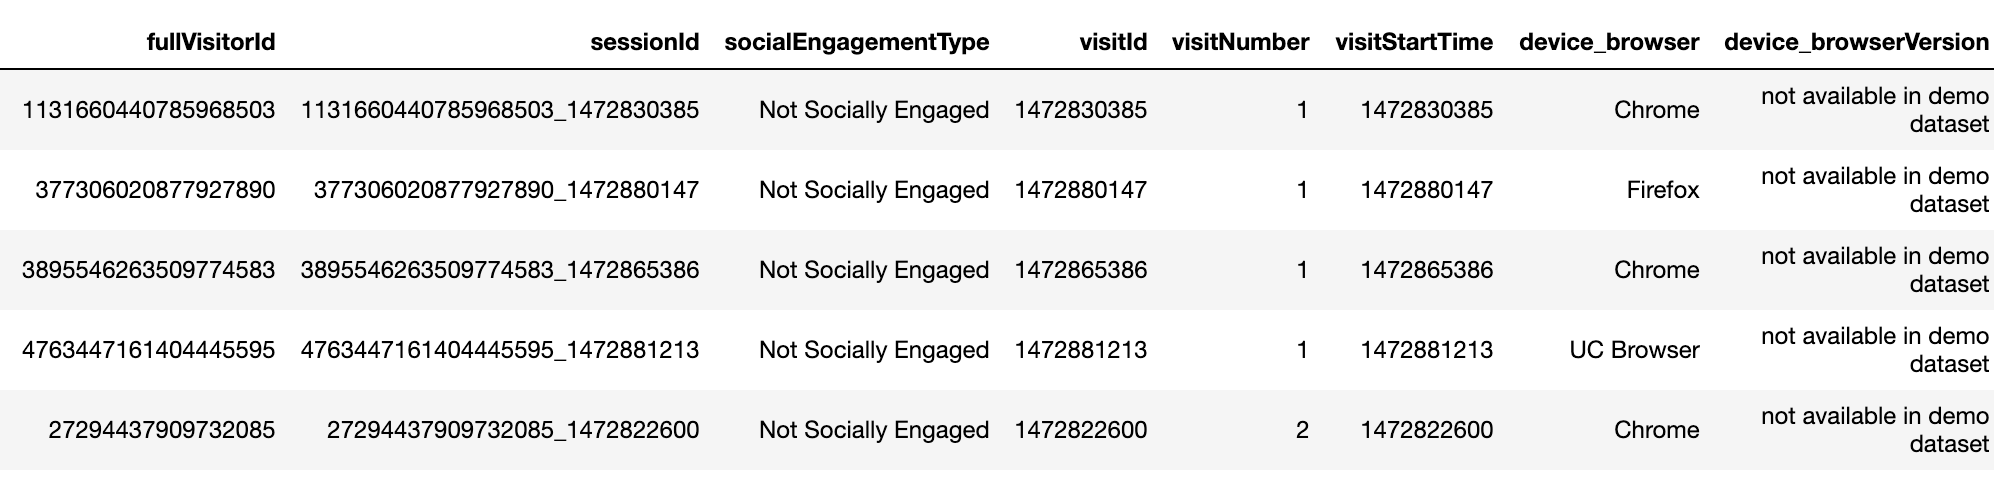
After flattening those JSON fields, we are able to see a much cleaner dataset, especially those JSON variables split into sub-variables (e.g. device split into device_browser, device_browserVersion, etc.).
2. Data Re-formatting & Grouping
For this project, I have chosen the variables that I believe have better impact or correlation to the user behaviours:
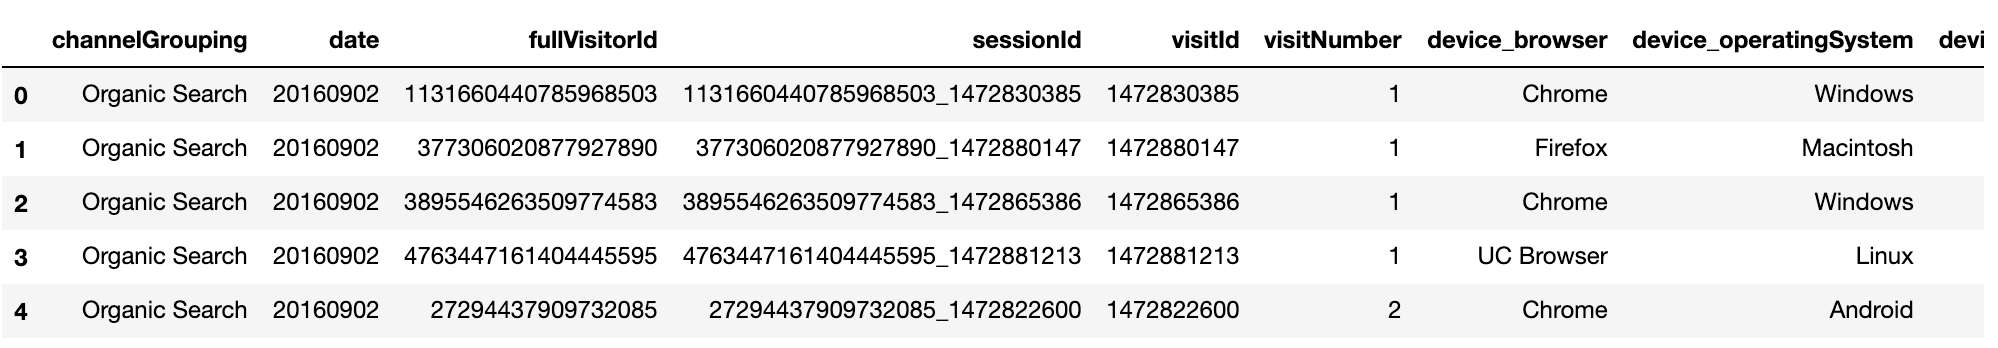
df = df.loc[:,['channelGrouping', 'date', 'fullVisitorId', 'sessionId', 'visitId', 'visitNumber', 'device_browser', 'device_operatingSystem', 'device_isMobile', 'geoNetwork_country', 'trafficSource_source', 'totals_visits', 'totals_hits', 'totals_pageviews', 'totals_bounces', 'totals_transactionRevenue']]
df = df.fillna(value=0)
df.head()
Moving on, as the new dataset has fewer variables which, however, vary in terms of data type, I took some time to analyze each and every variable to ensure the data is “clean enough” prior to modelling. Below are some quick examples of un-clean data to be cleaned:
#Format the values
df.channelGrouping.unique()
df.channelGrouping = df.channelGrouping.replace("(Other)", "Others")

#Convert boolean type to string
df.device_isMobile.unique()
df.device_isMobile = df.device_isMobile.astype(str)
df.loc[df.device_isMobile == "False", "device"] = "Desktop"
df.loc[df.device_isMobile == "True", "device"] = "Mobile"
#Categorize similar values
df['traffic_source'] = df.trafficSource_source
main_traffic_source = ["google","baidu","bing","yahoo",...., "pinterest","yandex"]
df.traffic_source[df.traffic_source.str.contains("google")] = "google"
df.traffic_source[df.traffic_source.str.contains("baidu")] = "baidu"
df.traffic_source[df.traffic_source.str.contains("bing")] = "bing"
df.traffic_source[df.traffic_source.str.contains("yahoo")] = "yahoo"
.....
df.traffic_source[~df.traffic_source.isin(main_traffic_source)] = "Others"
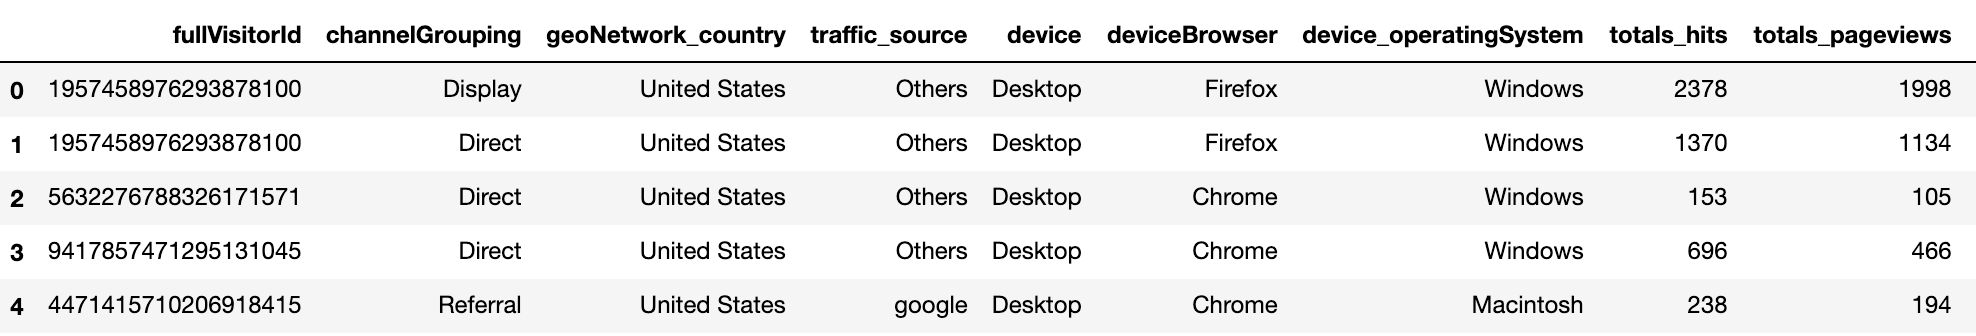
After re-formatting, I found that fullVisitorID’s unique values are fewer than the total rows of the dataset, meaning there are multiple fullVisitorIDs that were recorded. Hence, I proceeded to group the variables by fullVisitorID and sort by Revenue:
df_groupby = df.groupby(['fullVisitorId', 'channelGrouping', 'geoNetwork_country', 'traffic_source', 'device', 'deviceBrowser', 'device_operatingSystem'])
               .agg({'totals_hits':'sum', 'totals_pageviews':'sum', 'totals_bounces':'sum','totals_transactionRevenue':'sum'})
               .reset_index()
df_groupby = df_groupby.sort_values(by='totals_transactionRevenue', ascending=False).reset_index(drop=True)
#machine-learning #k-means #segmentation #data-science #clustering