In this article, we will discuss the detailed process of surface soil moisture (top 5 cm) estimation using satellite images. This article is divided into five sections. First, we will see the satellite images used then we will see the study area. Afterwards, we will go through the models. Then we will see the detailed methodology. Lastly, we will see the results, discussion and conclusion section.
You can download the paper from MDPI website. You can write to me (abhilash.singh@ieee.org)if you have any question or visit my web page for more updates
Satellite images
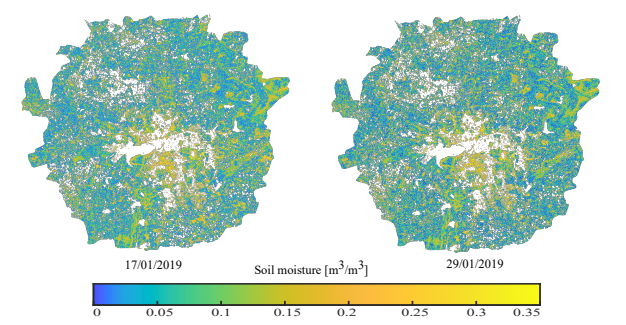
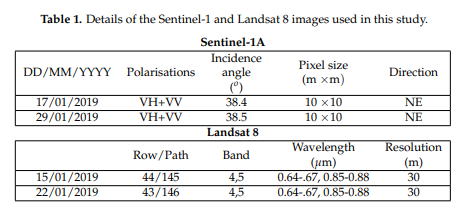
In this study, we have used the microwave and optical satellite images (Table 1) to estimate soil moisture. We have downloaded publicly available Sentinel-1A images of two consecutive pass, i.e., 17 and 29 January 2019 from the European Space Agency. We have also downloaded Landsat 8 images from the United States Geological Survey pertaining to the date closest to the Sentinel-1A images.
We have used Sentinel Application Platform (SNAP) v6.0 to process the Sentinel-1A images. The processing involves four major steps, radiometric calibration, multi look, speckle noise reduction using refined Lee filter, and terrain correction. Terrain or geometric calibration employs the Shuttle Radar Topography Mission (SRTM) digital elevation model of spatial resolution 30 meters. The resulting image pixels contain the true backscatter (σ ) values on a linear scale. Finally, we convert the backscatter values into decibel scale σ(dB) according to, σ (dB) = 10 ∗ log10(σ )
#remote-sensing #drought-monitoring #soil-moisture #satellite-imagery #big-data-analytics