Often times you hear that coaches are praised because of their ability to draw and execute After Timeout (ATO) Play, however, we’ll take a look if there is any correlation between the successful realization of ATO play and team’s win percentage. Furthermore, I’ll take a look at who are some of the most successful players in executing those same actions.
Data
The data is collected through the NBA’s Play by Play data. I found all the timeouts in this year’s season, which totaled up to 10905 timeouts. The goal after that was to find the next action. Here are all of the “next actions” that occurred, I filtered out the substitutions:
- Missed Shots: 3927
- Made Shots: 3030
- Fouls: 1463
- Turnovers: 1106
- Free Throws: 1095
- Jump Ball: 100
- Violation: 71
- Timeout: 53
- End of Game: 31
- Offensive Foul: 29
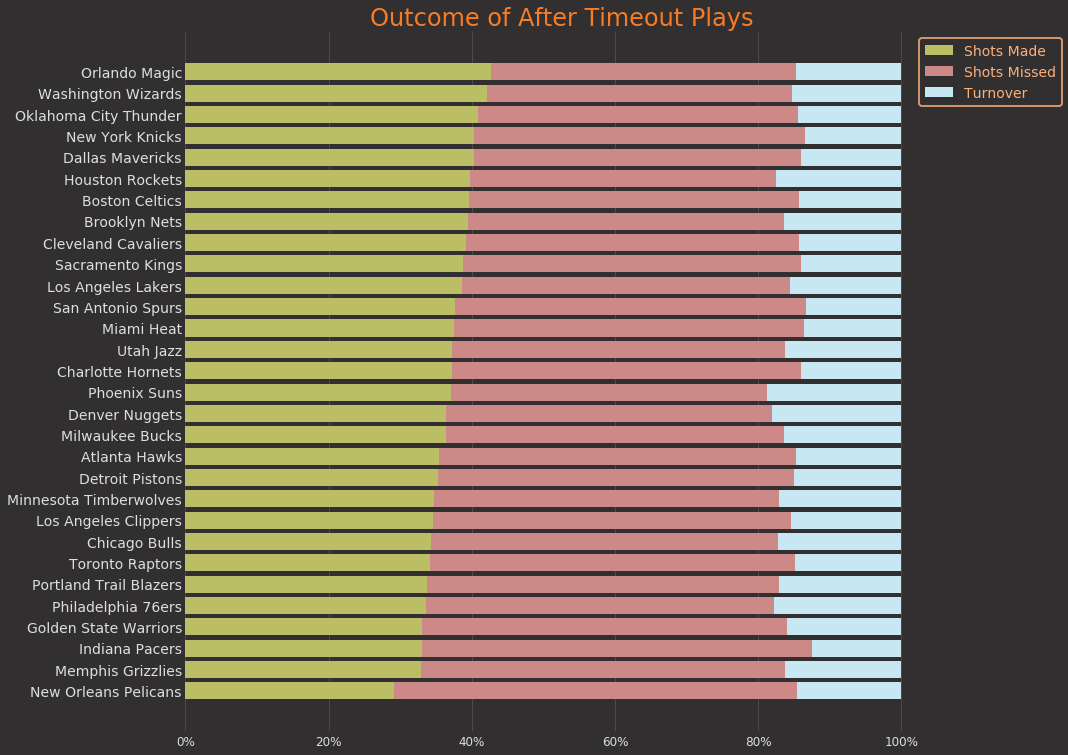
As you can see, this is rather non-optimal data, we can filter out even more stuff here. So I also skipped Free Throws (because TO was called after foul/between free throws), Timeouts, Jump Balls (same as FTs), Violations (because that was some sort of delay of the game which didn’t affect the action), and classified Offensive Foul as Turnover (which it is). I simply removed End of Game actions, because I can’t really tell anything from them. The result of that is the following:
- Missed Shots: 4047
- Made Shots: 3121
- Turnovers: 1307
- Fouls: 1136
#basketball #sports-analytics #data-visualization