How to create simple app with Nuxt and Morris for displaying charts
First step, create the app with Nuxt
Nuxt is one of my favourite framework at the moment: if you are familiar with Vue.js, building an application with Nuxt is the next step to a simpler and more beautiful world
So, let’s start by creating the application with the command npx create-nuxt-app
$ npx create-nuxt-app npx : 379 installé(s) en 16.616s> Generating Nuxt.js project in /Dev/world-bank-data
? Project name: world-bank-data
? Project description: A wonderful app with Nuxt and Morris
? Use a custom server framework: none
? Choose features to install: Axios
? Use a custom UI framework: none
? Use a custom test framework: none
? Choose rendering mode: Single Page App
? Author name: Bruno
? Choose a package manager: npmTo get started:
npm run devTo build & start for production:
npm run build npm start
Important: selectaxiosas a feature to install and chooseSingle Page Appfor the rendering mode.
Now, you can start your application with npm run dev and open http://localhost:3000. You should get something like that:
Next step, add dependencies, plugins, etc
We need two other dependencies for our application:
vue-lodash: a library that provides utility functions (will be used to parse the result of the APIvue-morris: a wrapper of Morris.js for Vue.js (it is a little bit old, but very efficient)
Let’s add these required dependencies :
npm i vue-lodash vue-morris --save
For a simpler use of certain dependencies, Nuxt can be enriched with plugins. Let’s do it with vue-lodash and vue-morris.
Create two files: plugins/vue-lodash.js and plugins/vue-morris.js and update nuxt.config.js to declare these plugins.
- nuxt.config.js
export default {
/*

** Plugins to load before mounting the App

*/

plugins: [

‘~/plugins/vue-lodash’,

‘~/plugins/vue-morris’

],

}
- vue-lodash.js
import Vue from ‘vue’
import VueLodash from ‘vue-lodash’// To be able to use this._ or Vue._ in the components without including lodash
Vue.use(VueLodash)
- vue-morris.js
import Raphael from ‘raphael/raphael’
import jQuery from ‘jquery’// This is needed by Morris
global.Raphael = Raphael
global.jQuery = jQuery
Final step, add a new page with the chart
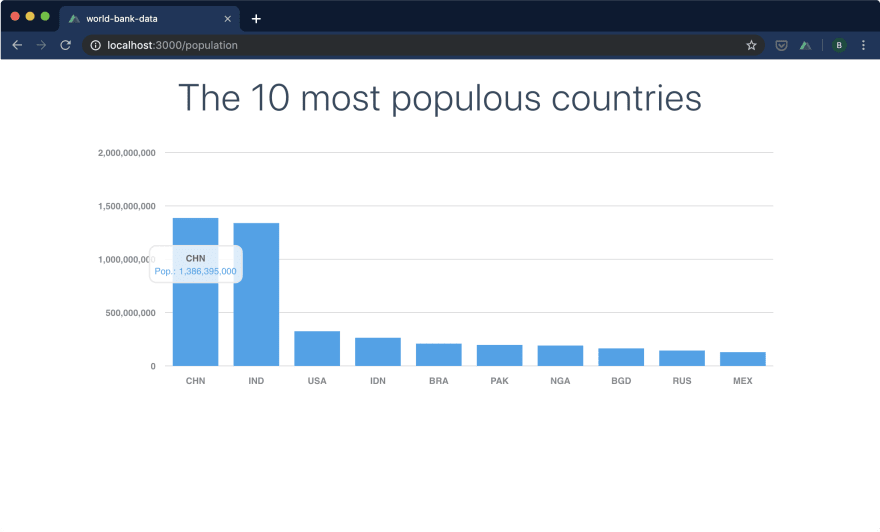
Now, we are going to create a page to display the 10 most populous countries in a bar chart.
The service used for this example is the API of the World Bank. They provide a lot of data, very interesting ! For more information about the API, check this page.
In our example, we use this URL: http://api.worldbank.org/v2/country/all/indicator/SP.POP.TOTL?date=2018&format=json&per_page=300&mrv=1
Parameters:
- SP.POP.TOTL: name of the indicator (in our case, the population)
- date: range of date (I just set the last year, I don’t want historical data)
- format: format of the result (it can be XML, JSON, …)
- per_page: number of result for each query (I set it to 300 to get all the results in a single query, no paging)
- mrv: fetches most recent values based on the number specified (I set it to 1, to get only the last recent value)
To query this API and get the most populous countries, the code will look like (in this method, we filter the values, sort according to the value field and keep only 10 values):
this.$axios.$get(‘http://api.worldbank.org/v2/country/all/indicator/SP.POP.TOTL?date=2018&format=json&per_page=300&mrv=1’)

.then(data => {

this.countries = this._.chain(data[1])

.filter(d => d.value && d.countryiso3code)

.sortBy(‘value’)

.value()

.slice(-10)

.reverse()

})
Let’s add a new file: pages/population.vue
- The
<script>part: we importBarChartfromvue-morrisand add amountedfunction that invoke the API (see above) - The
<template>part: we use thebar-charttag for displaying the result of the call to the API.
<template>
<section class=“container”>
<h1 class=“title”>The 10 most populous countries</h1>
<bar-chart id=“bar”
:data=“countries”
xkey=“countryiso3code”
ykeys=‘[“value”]’
labels=‘[“Pop.”]’
resize=“true”
bar-colors=‘[ “#36A2EB” ]’
grid=“true”
grid-text-weight=“bold”>
</bar-chart>
</section>
</template><script>
import { BarChart } from ‘vue-morris’
export default {
components: {
BarChart
},
data() {
return {
countries: []
}
},
mounted() {
this.$axios.$get(‘http://api.worldbank.org/v2/country/all/indicator/SP.POP.TOTL?date=2018&format=json&per_page=300&mrv=1’)
.then(data => {
this.countries = this._.chain(data[1])
.filter(d => d.value && d.countryiso3code)
.sortBy(‘value’)
.value()
.slice(-10)
.reverse()
})
}
}
</script>
Now, if you open the URL http://localhost:3000/population, you should see something like that:
Finally, we are going to create a link to navigate from the home page to the population page: update the file pages/index.vue, replace the two buttons by a <nuxt-link> (you can also remove the logo).
<template>

…

<nuxt-link to=“/population” class=“button–grey”>World population</nuxt-link>

…

</template>
Conclusion
As you can see, it’s very easy to create an application with Nuxt and add a simple chart framework to get rich and interactive pages.
The source code is available on github: https://github.com/bbonnin/medium-nuxt-morris.
Hope this tutorial will surely help and you!
Thanks For Visiting, Keep Visiting.
☞ Vue JS 2 - The Complete Guide (incl. Vue Router & Vuex)
☞ Nuxt.js - Vue.js on Steroids
☞ Build Web Apps with Vue JS 2 & Firebase
☞ Best JavaScript Frameworks, Libraries and Tools to Use in 2019
☞ Implementing Authentication in a Nuxt.js App
☞ Best 7 Nuxt Tips for Beginners
Originally published on medium.com
#vue-js #nuxt-js #javascript