Like all infectious diseases, Covid-19 transmission happens on a very local level. It does not just jump randomly around the world, it has to pass from person to person, and these people will have to travel to a new place to spread the virus there. It is for this reason that networks have often been used to help model the spread of diseases, whether it’s by using a social network to model the spread of the disease between people, or geographic networks to help us predict outbreaks based on what’s going on in neighbouring places.
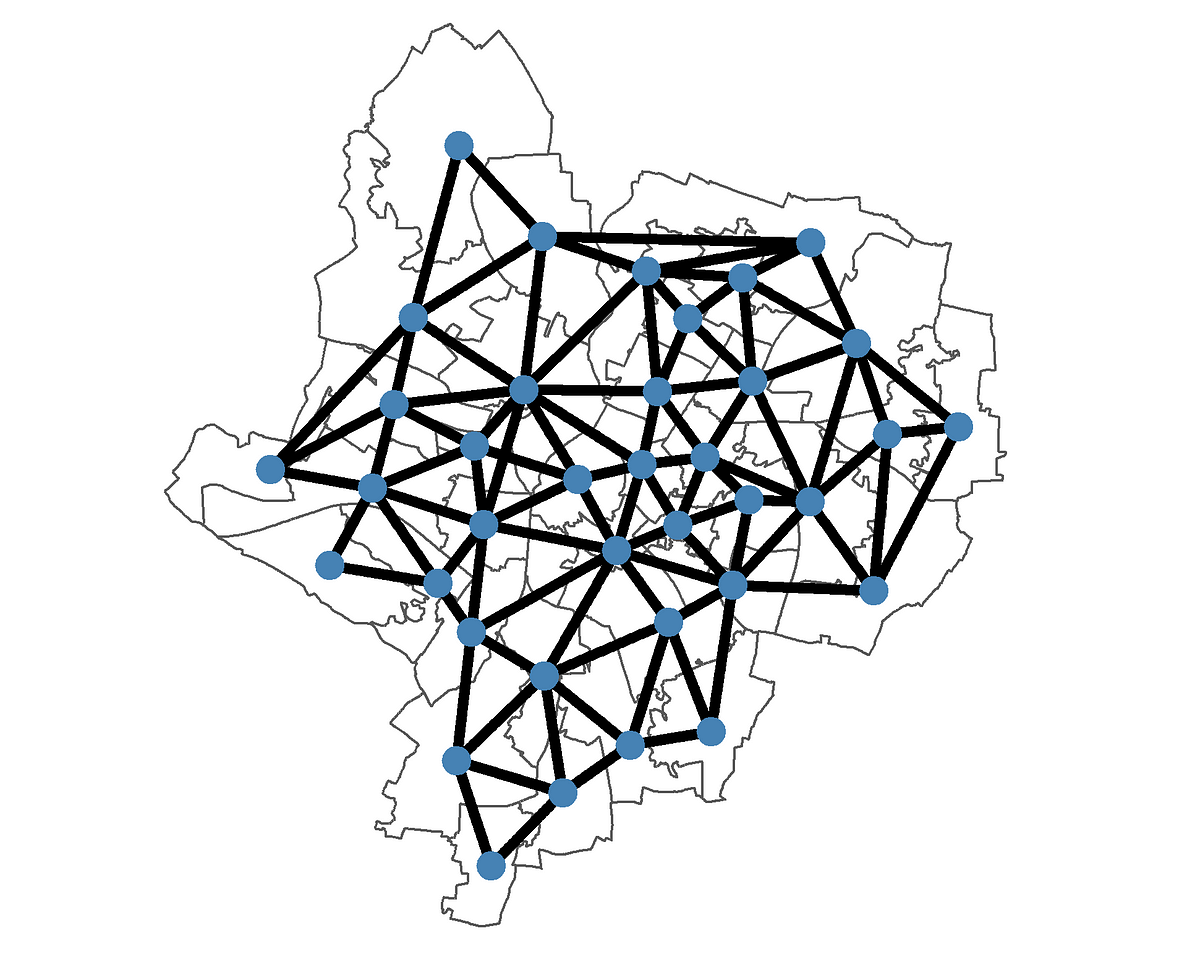
In this blog series, we will be focusing on geographic networks, where the nodes are places, and the edges link two places if they neighbour each other. Ultimately we will try and use such a network to predict Covid cases in one area based on Covid cases in neighbouring areas.
The accuracy of this approach will be limited as it does not take account of epidemiological factors (such as herd immunity and social distancing) or other ways areas are linked (such as trains). However, this blog series still provides a helpful guide for visualising networks and using them to create features for predictive analysis. It also shows that network analysis can be a helpful piece of a larger Covid model.
In the UK, the smallest areas of geography that Covid cases are published on are called Middle Layer Super Output Areas (MSOAs) so we will focus on these. You can see this data in an interactive map here, and download it here.
In this first part, we will create some visualisations to motivate why such an approach might work, then we will create the network seen in the above image. We will showcase code as we go along, and also, all of the code can be found on github.
These are all the packages that were used to create the visualisations shown in this post.
## Set up ----
## Load packages
library(dplyr)
library(readr) ## Loading the data
library(tidyr)
library(sf) ## For the maps
library(sp) ## Transform coordinates
library(ggplot2)
library(viridis)
library(gganimate) ## For the animated map
## Network packages
library(igraph) ## build network
library(spdep) ## builds network
library(tidygraph)
library(ggraph) ## for plotting networks
#predictions #covid19 #r #data-science #network