This article is based on my entry into DengAI competition on the DrivenData platform. I’ve managed to score within 0.2% (14/9069 as on 02 Jun 2020). Some of the ideas presented here are strictly designed for competitions like that and might not be useful IRL.
Before we start I have to warn you that some parts might be obvious for more advanced data engineers, and it’s a very long article. You might read it section by section of just pick the parts that are interesting for you.
Problem description
First, we need to discuss the competition itself. DengAI’s goal was (actually, at this moment even is, because the administration of DrivenData decided to make it “ongoing” competition, so you can join and try yourself) to predict a number of dengue cases in the particular week base on weather data and location. Each participant was given a training dataset and test dataset (not validation dataset). MAE ( Mean Absolute Error) is a metric used to calculate score and the training dataset covers 28 years of weekly values for 2 cities (1456 weeks). Test data is smaller and spans over 5 and 3 years (depends on the city).
For those who don’t know, Dengue fever is a mosquito-borne disease that occurs in tropical and sub-tropical parts of the world. Because it’s carried by mosquitoes, the transmission is related to climate and weather variables.
Dataset
If we look at the training dataset it has multiple features:
City and date indicators:
- city — City abbreviations: sj for San Juan and iq for Iquitos
- week_start_date — Date given in yyyy-mm-dd format
NOAA’s GHCN daily climate data weather station measurements:
- station_max_temp_c — Maximum temperature
- station_min_temp_c — Minimum temperature
- station_avg_temp_c — Average temperature
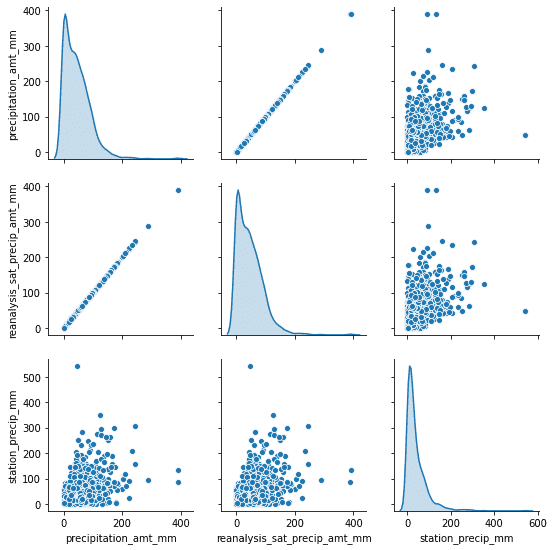
- station_precip_mm — Total precipitation
- station_diur_temp_rng_c — Diurnal temperature range
PERSIANN satellite precipitation measurements (0.25x0.25 degree scale):
- precipitation_amt_mm — Total precipitation
NOAA’s NCEP Climate Forecast System Reanalysis measurements (0.5x0.5 degree scale):
- reanalysis_sat_precip_amt_mm — Total precipitation
- reanalysis_dew_point_temp_k — Mean dew point temperature
- reanalysis_air_temp_k — Mean air temperature
- reanalysis_relative_humidity_percent — Mean relative humidity
- reanalysis_specific_humidity_g_per_kg — Mean specific humidity
- reanalysis_precip_amt_kg_per_m2 — Total precipitation
- reanalysis_max_air_temp_k — Maximum air temperature
- reanalysis_min_air_temp_k — Minimum air temperature
- reanalysis_avg_temp_k — Average air temperature
- reanalysis_tdtr_k — Diurnal temperature range
Satellite vegetation — Normalized difference vegetation index (NDVI) — NOAA’s CDR Normalized Difference Vegetation Index (0.5x0.5 degree scale) measurements:
- ndvi_se — Pixel southeast of city centroid
- ndvi_sw — Pixel southwest of city centroid
- ndvi_ne — Pixel northeast of city centroid
- ndvi_nw — Pixel northwest of city centroid
Additionally, we have information about the number of total_cases each week.
It is easy to spot that for each row in the dataset we have multiple features describing similar kinds of data. There are four categories:
-
temperature
-
precipitation
-
humidity
-
ndvi (those four features are referring to different points in the cities, so they are not exactly the same data)
Because of that, we should be able to remove some of the redundant data from the input. Ofc, we cannot just pick one temperature randomly. If we look at just temperature data there is a distinguishment between ranges (min, avg, max) and even type (mean dew point or diurnal).
#machine-learning #kaggle #data-science #data-analysis #data analysis