The code is available here on Github.
What is an image histogram?
Before start defining the histogram, for simplicity, we use grayscales images. Then later I explain the process for the color images as well.
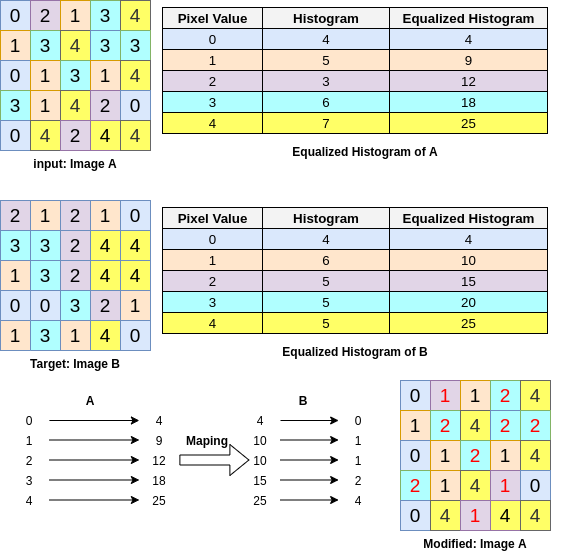
The image histogram indicates the intensity distribution of an image. In other words, the image histogram shows the number of pixels in an image having a specific intensity value. As an example, assume a normal image with pixel intensities varies from 0 to 255. In order to generate its histogram we only need to count the number of pixels having intensity value 0, then 1 and continue to the 255. In Fig.1, we have a sample 5*5 image with pixel diversities from 0 to 4. In the first step for generating the histogram, we create the Histogram Table, by counting the number of each pixel intensities. Then we can easily generate the histogram by creating a bar chart based on the histogram table.
How to generate an image histogram?
In python, we can use the following two functions to create and then display the histogram of an image.
import matplotlib.pyplot as plt
	import numpy as np

	def generate_histogram(img, do_print):
	    """
	    @params: img: can be a grayscale or color image. We calculate the Normalized histogram of this image.
	    @params: do_print: if or not print the result histogram
	    @return: will return both histogram and the grayscale image
	    """
	    if len(img.shape) == 3: ## img is colorful, so we convert it to grayscale
	        gr_img = np.mean(img, axis=-1)
	    else:
	        gr_img = img
	    '''now we calc grayscale histogram'''
	    gr_hist = np.zeros([256])

	    for x_pixel in range(gr_img.shape[0]):
	        for y_pixel in range(gr_img.shape[1]):
	            pixel_value = int(gr_img[x_pixel, y_pixel])
	            gr_hist[pixel_value] += 1

	    '''normalizing the Histogram'''
	    gr_hist /= (gr_img.shape[0] * gr_img.shape[1])
	    if do_print:
	        print_histogram(gr_hist, name="n_h_img", title="Normalized Histogram")
	    return gr_hist, gr_img

	  def print_histogram(_histrogram, name, title):
	    plt.figure()
	    plt.title(title)
	    plt.plot(_histrogram, color='#ef476f')
	    plt.bar(np.arange(len(_histrogram)), _histrogram, color='#b7b7a4')
	    plt.ylabel('Number of Pixels')
	    plt.xlabel('Pixel Value')
	    plt.savefig("hist_" + name)
Most of the time when we create a histogram, we normalize the histogram by dividing the number of pixels with each intensity value by the normalizing factor which is the multiplication of the image width and image height. For ease of use, if the input image of the generate_histogram function is a color image, we first convert to a grayscale image(see line## 6).
#computer-vision #histograms #image-processing #python #histogram-equalization