Predicting stock prices is a difficult task. Several factors can affect the price of the stock which is not always easy to accommodate in a model. There is no model in the world currently which can accurately predict the stock prices and there might never be one owing to the reasons mentioned above. Facebook has given a “state of the art model” and “easy to use” and a wide range of hyperparameter tuning options to give somewhat accurate predictions.

Pre-processing
As mentioned above, we have a dataset that has stock prices for New Germany Fund from the year 2013 to 2018. Now as we import the data and see it for the first time, we see that it is not sorted in the ascending order of the dates, This is a major issue as forecasted values are more likely to depend on the immediate past entries rather than entries before.
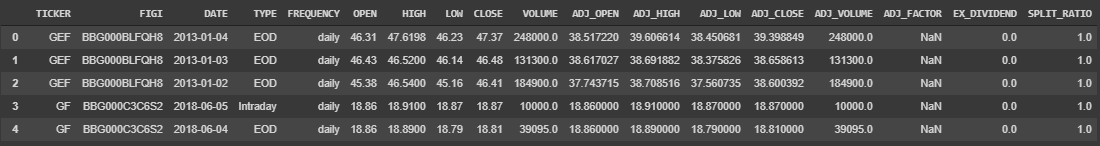
Unsorted Dataset.
stock_prices['DATE'] = pd.to_datetime(stock_prices["DATE"])
stock_prices = stock_prices.sort_values(by="DATE")
After this, we plot the values of the opening price by date.
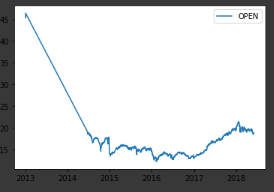
Figure 1
As you can see there is a sudden drop in values from 2013 to 2014 which is very unusual. A possible reason for this is that there may be very few values for the year 2013. We check that using the following code.
stock_prices = stock_prices[stock_prices.Year == 2013]
The above code results in a dataset with only 3 entries. We remove these values.
stock_prices = stock_prices[stock_prices.Year != 2013]
The data finally looks like:
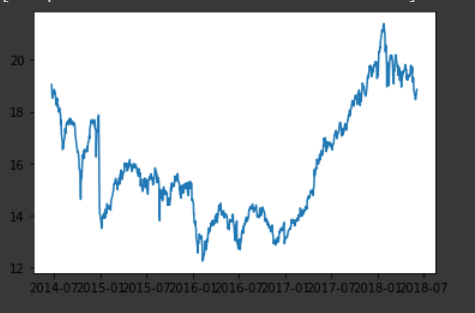
Figure 2
We also need to set the index of our dataset as the date, but we can’t access the date as it is now a Dataframe index. To resolve this issue, we will first create a copy of the Date column.
stock_prices[‘date’] = stock_prices[‘DATE’]
stock_prices.set_index("DATE", inplace = True)
Exploratory Data Analysis
The autocorrelation gives us insight into the seasonality of the model. In case the correlation value is high for a certain number of lags, that lag number is the seasonality.
Lag of value one corresponds to one day as the time step in our dataset is a day.
Evident from the below plot, the correlation is high for lags close to 0. The value of autocorrelation seems to decrease for a higher value of lags. Implying that as such, there is no seasonality within our data.
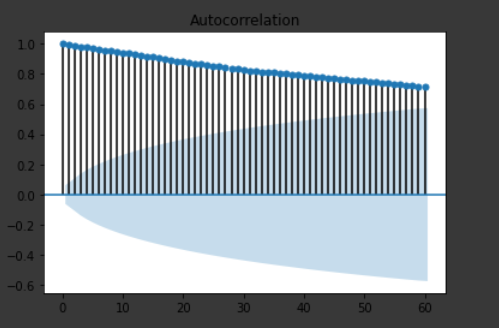
Autocorrelation vs Lags
We further gain insight into the yearly growth in data. The year 2017 has the largest area, hence the most growth.

Growth vs Years
#time-series-forecasting #prophet #stock-prediction #forecasting #machine-learning #deep learning
