Short and long-term forecasting is an essential business activity in every sector for decision-making. Call centers need to know the increase in call volumes five years from now to maintain adequate staffing to serve the customers. Electric companies want to forecast growth in power consumption in the next ten years so they can invest in new installations to keep up with additional demands. Small businesses need to see how their investments are paying off over the next few years and make necessary adjustments.
All these business needs require forecasting. Traditionally these forecasting is done on an _ad hoc _basis with limited tools at the disposal of data scientists. Time series techniques have been around for a long time, but they have their own limitations and often they do not provide necessary accuracy and point toward specific uncertainties. With time series it is also difficult to develop scenarios and do sensitivity analysis of key performance indicators (KPIs) as a result of new policies.
With that in mind, in this article I introduce a blueprint for a different kind of forecasting technique that relies rather on few data points. As well will see below, this technique also allows for scenario analysis of the impacts of specific business decisions and their impacts on KPIs.
System dynamic modeling
System Dynamics is a methodological approach for complex systems modeling, where a change in one element leads to a change in others.
It is widely applied in healthcare, epidemiology, transportation, business management, and revenue forecasting. Arguably the most famous of all is modeling Limits to Growth by the Club of Rome.
A System Dynamic model represents a complex system in terms of stocks & flows and their interactions via feedback loops to predict the behavior of the system. Let’s say a bank account has a “stock” of $100. Every month $20 is deposited (represented by Flow 1), and an amount of $15/month is withdrawn (Flow 2). In this simple case, a change in Flow 1 will cause a change in Stock 1 and _Flow 2. _So if we know how Flow 1 will evolve into the future, we can forecast both Stock 1 and Flow 2.
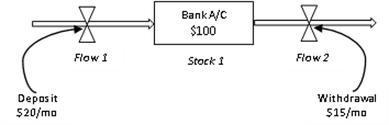
Stocks, flows and feedback loops in SD modeling (source: author)
Using a similar concept, below I’m presenting an approach to forecasting that depends on fewer data points rather than complex time series modeling which is used in traditional forecasting.
A simple blueprint with necessary codes is presented below. I’m also testing it in GDP forecasting of three major economies in the world. But this concept can be applied to any other business forecasting and decision-making process.
#visualization #systems-thinking #forecasting #business-intelligence #data-science