My manager thinks I know how to run a regression analysis using R. So, to save my butt, I decided to dedicate my whole weekend to learning how to do it. Think of this post as a crash course intro to learn how to brute force your way into doing one.
Skip to the section you want to read. Table of contents below:
- Part I | My scope of knowledge upon beginning to write this post
- Part II | How I searched for my resources
- Part III | Regression tips: learnings from an engineer
- Part IV | 7 copy & paste steps to run a linear regression analysis using R
- Part V | Next steps: Improving your model
Part I | My scope of knowledge upon beginning to write this post
First, to establish grounds, let me tell you what I do know about regression, and what I can do in R.
What I know about linear regression going into the weekend:
- The equation is in the format: y=ax+b, where y is the dependent variable, x is the independent variable, a is a coefficient, and b is a constant/y-intercept. I know what each of these terms means.
- It’s a way of figuring out the impact the independent variable x has on the dependent variable y. In order to do this, you take the existing data that you have and test all of the cases against this equation to find the most appropriate a and b in order to predict y values that you don’t have data for.
- You can add any number of independent variables with a coefficient attached to each to see the impact each has on the dependent variable. That said, too many variables will not improve the model and in some cases hurt it.
- It’s best to normalize your data so that you work with values between 0 and 1. That way, coefficients aren’t tiny or enormous because of the nature of the independent variables (e.g. 4634 days vs 13 years are two variables you can use in the same model, but because they are so different in size, the coefficients would probably be skewed).
What I can do in R going into the weekend:
- Basic data wrangling in dplyr (
mutate,filter,select, pipe operator%>%,summarize, dot placeholder,group_by,arrange,top_n) - Plots in dplyr (
plot,hist,boxplot) - Plots in ggplot2 (the geoms,
facet_grid, time series plots, axis transformations,stratify,boxplot, slope charts) - I learned everything I know about R from two online courses I’ve taken so far (1. R Basics, 2. Visualization).
Part II | How I searched for my resources
How I figured out what to focus on this weekend.
1. r-bloggers has been a good resource for me while learning R basics, so I decided to start there. I googled “r-bloggers regression.”
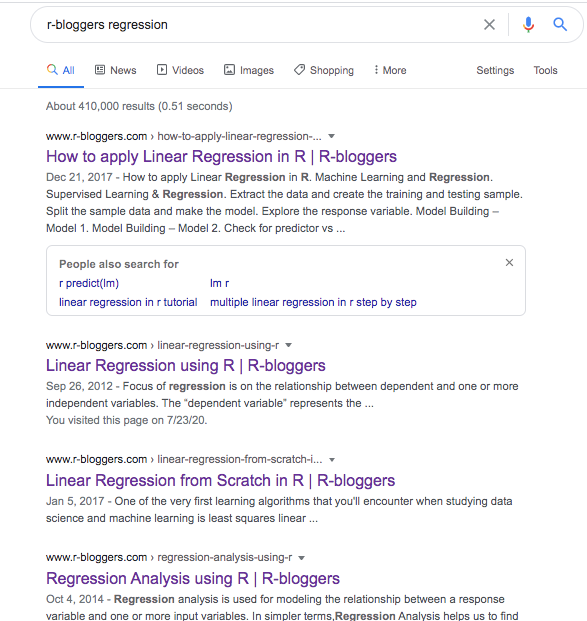
Google search results for “r-bloggers regression.”
These are the top four links that came up for me:
- https://www.r-bloggers.com/how-to-apply-linear-regression-in-r/
- https://www.r-bloggers.com/linear-regression-using-r/
- https://www.r-bloggers.com/regression-analysis-using-r/
- https://www.r-bloggers.com/linear-regression-from-scratch-in-r/
2. I skimmed through each of them and decided to focus on the second result because I saw at the bottom of the page that it mentioned it was going to tell me how to do a “real-world business problem.”
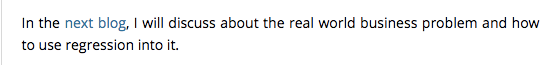
A quote from the blog I chose to reference.
I clicked the link “next blog,” and BINGO! “Predict Bounce Rate based on Page Load Time in Google Analytics.” Since I didn’t mention already, to note here: I am in the performance advertising space, so this is literally right up my alley. They even do a part 3 on improving the model!
I’ve found what I’m going to focus on this weekend. Going to compile learnings here as I learn anything!
Part III | Regression tips: learnings from an engineer
I had a really helpful conversation with an engineer who entertained my questions this weekend, and I’d like to share with you some tips that he shared. In summary, running a regression analysis is just the start of your investigation in assessing whether some data has a relationship with other data. With that context, here are ways you can ensure you come up with an analysis that is honest and helps you figure out your next steps.
- Normalize the data so that you can compare coefficients as fairly as possible. Though there isn’t a set way to compare coefficients of independent variables apples to apples with each other, normalizing data allows you to at least be able to eyeball the impact that an independent variable has on the dependent variable. This is a great starting point for research: once you see that one coefficient is larger than another, you can begin to investigate what is causing any “high” coefficients. If you don’t normalize your data, you can have a massive range of values for each, resulting in the coefficients also ranging widely in order to compensate for the weight of larger values.
- **p-value significance is an indicator of certainty. **Even if a coefficient is high, if it is not statistically significant, it’s at best meaningless, and at worst ruining the model. (See section “The Asterisks” in this blog post to learn about how to read p-values.)
- Remove outliers when running the regression, then after creating the model, test the model with each of the outliers to compare the predicted vs true values for the dependent variable. This allows you to see how robust your model is. If the error for the outliers is low, then it’s a huge win for the model; if the error is still high, then you can simply continue to assert the fact that they are outliers.
- **In addition to looking at the aggregate error, it’s also important to look at the error of each individual data point. **By doing this, you can dig into any reasons or trends as to why a certain point or set of points might have a larger error than others.
- **Crap in, crap out. **Without good data, you’re not going to have good results. Make sure you know where your data is coming from, and make sure it’s high quality.
#regression #data-science #data-analysis #r #data analysis