Copper prices have seen a significant slump in the first quarter of 2020. According to the World Bank, this is in large part due to the large decline that we have been seeing in the manufacturing sector and stimulus measures are having a limited effect in supporting prices.
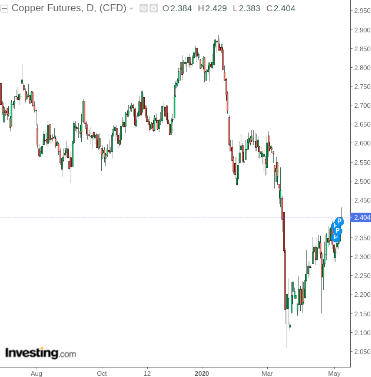
Source: investing.com
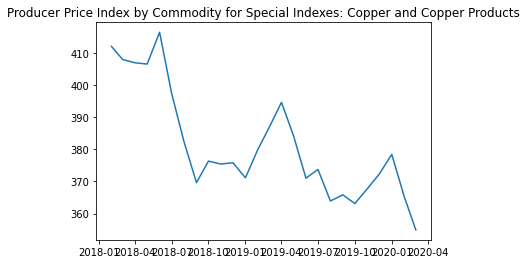
Accordingly, the producer price index has also been falling.
However, is it necessarily a given that we can expect these trends to continue looking forward?
To answer this question, let’s consider a time series analysis using the following:
- Cointegration
- Cross-correlation
- Forecasting of inflation and 10-Year US Treasury Rates with ARIMA
Given that copper prices are stochastic in nature (i.e. follow a random walk), forecasts are not made using copper prices outright. Rather, this analysis investigates the correlations between copper and the 10-year US Treasury Rate, with a view to inferring the potential direction for copper from forecasts of US inflation and the 10-year US Treasury Rate.
For the purposes of this analysis, the copper price producer index and the 10-year US Treasury Rate is split into the following time periods for training and validation purposes:
Training: January 1981 to January 2018
Validation: February 2018 to March 2020
The relevant time series were sourced from the FRED (Federal Reserve Economic Data) source through Quandl.
The sourced time series are as follows:
- 10 Year Treasury Constant Maturity Rate (FRED/GS10)
- Producer Price Index by Commodity for Special Indexes Copper and Copper Products (FRED/WPUSI019011)
- U.S. Inflation Data (FRED/FPCPITOTLZGUSA)
The producer price index and 10-year treasury data is in monthly format and the U.S. inflation data is in yearly format.
Cointegration and Cross-Correlation
When working with time series analysis, cointegration testing is used in order to determine whether correlations between two time series are theoretically relevant or simply due to chance.
In addition, cross-correlation is used to infer whether there is a leading or lagging relationship between the two indicators, e.g. US GDP is typically a lagging indicator for the S&P 500, while the S&P 500 is conversely a leading indicator for US GDP.
#timeseries #commodities #economics #data-science #machine-learning #data analysis