A step by step tutorial on how to create a simple Gantt Chart using matplotlib in python
Introduction: What is Gantt Chart
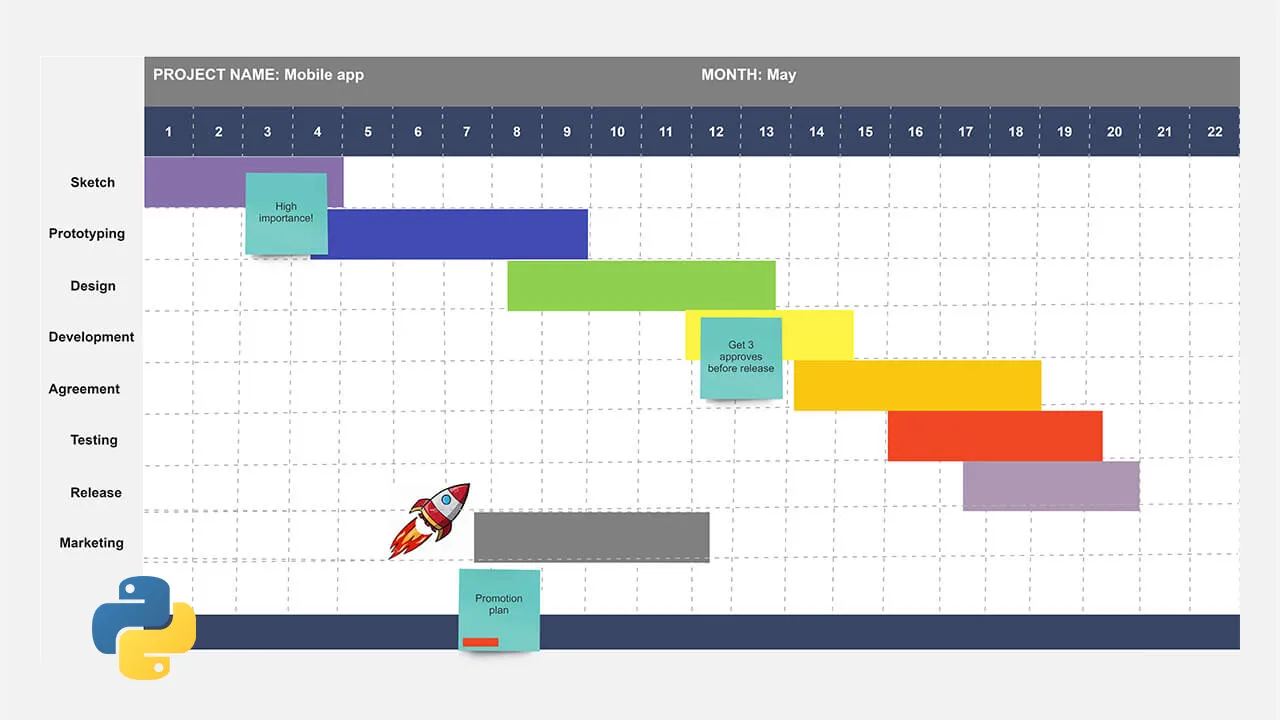
A Gantt chart, the most common method used in project management to visualize project schedule and status.
A Gantt chart is a type of bar chart showing activities (tasks or events) displayed against time.
The chart is named after its inventor, Henry Gantt, who designed such a chart around the early twentieth century.
In this article I will explain how to create a Gantt chart in python using matplotlib library.
Import Libraries
First step in programing a Gantt Chart is importing the required libraries:
1. Pandas : Reading data and data analytics
2. Matplotlib : Data visualization
3. Datetime : Date manipulation
import pandas as pd
import matplotlib.pyplot as plt
import datetime as dt
#data-visualization #python #matplotlib #gantt-chart #project-management #generate gantt chart in python
6.50 GEEK