Welcome to the Financial Blog post series, Part II! Here at Progress, we love attractive and alluring components. My team specifically loves attractive Angular components. Recently we built a demo Angular app that shows off a number of our gorgeous components working together to create this Financial Portfolio Demo App:
In this series, I walk through the Angular components that this app is composed of, and delve into the Kendo UI components that each one uses!
I’ve broken the application into five major Angular Components:
- Stock Chart
- Stock List
- User Profile
- Real Time Data
- Heatmap
In the first post, I covered the Stock Chart and Stock List components (and the child components they employ). Now, let’s find out how we built the User Profile, Real Time Data, and Heatmap Components!
Following Along
You can pull down the code and follow along—everything is available on GitHub and GitHub Pages!
- Clone the repo https://github.com/telerik/kendo-angular/tree/master/examples-standalone/finance-portfolio
- Go into the root of the application
cd kendo-angular/examples-standalone/finance-portfolio/ - Run
npm installandnpm start - Go to
http://localhost:4200in your web browser
Real Time Data—Data Virtualization
Building out the Grid with Kendo UI
I’ve covered the basics of the Kendo UI Grid pretty thoroughly in a video series and in this post here. Check it out if you are just getting started with the Grid from Kendo UI!
Since I’ve already covered the basics elsewhere, let’s go over the highlights of creating this real-time data grid. First, we of course installed and added the grid to our project:
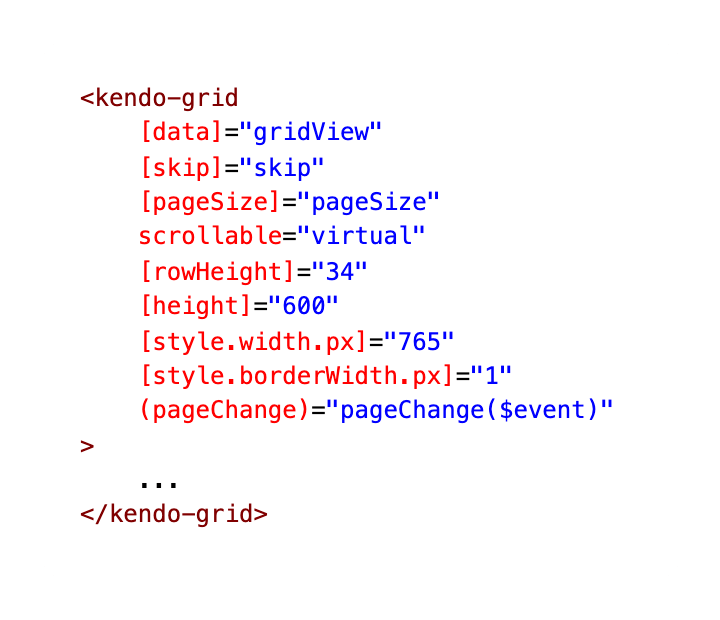
Virtual Scrolling within the Grid
As you can see, we are setting the scroll mode to virtual. The pageChange event is here for this virtual scrolling feature. In order to know when a page has changed, the virtual scrolling functionality of the Grid relies on calculations based on the fixed rowHeight as well as the set pageSize of the Grid. Read more about virtual scrolling in your Kendo UI Grid here: https://www.telerik.com/kendo-angular-ui/components/grid/scroll-modes/virtual/.
#angular