Stock prediction is a difficult task because the data generated is enormous and is highly non-linear. Modeling such dynamical data require effective modeling technique which can analyze the hidden patterns and underlying dynamics. Neural network which is deep learning algorithms are capable of identifying and exploiting the interactions and patterns existing in a data through a self learning process.We shall focus on a simple prediction model using long-short term memory architecture involving multiple time-series. We shall keep the whole exercise a simple process for illustration purpose and better understanding.Let us consider four different series S&P 500 (^GSPC), Dow Jones Industrial Average (^DJI), NASDAQ Composite (^IXIC) and Russell 2000 (^RUT) which is Chicago options. Our data set if from 1990 to till date.
stock = ['^RUT', '^GSPC', '^DJI', '^IXIC' ]
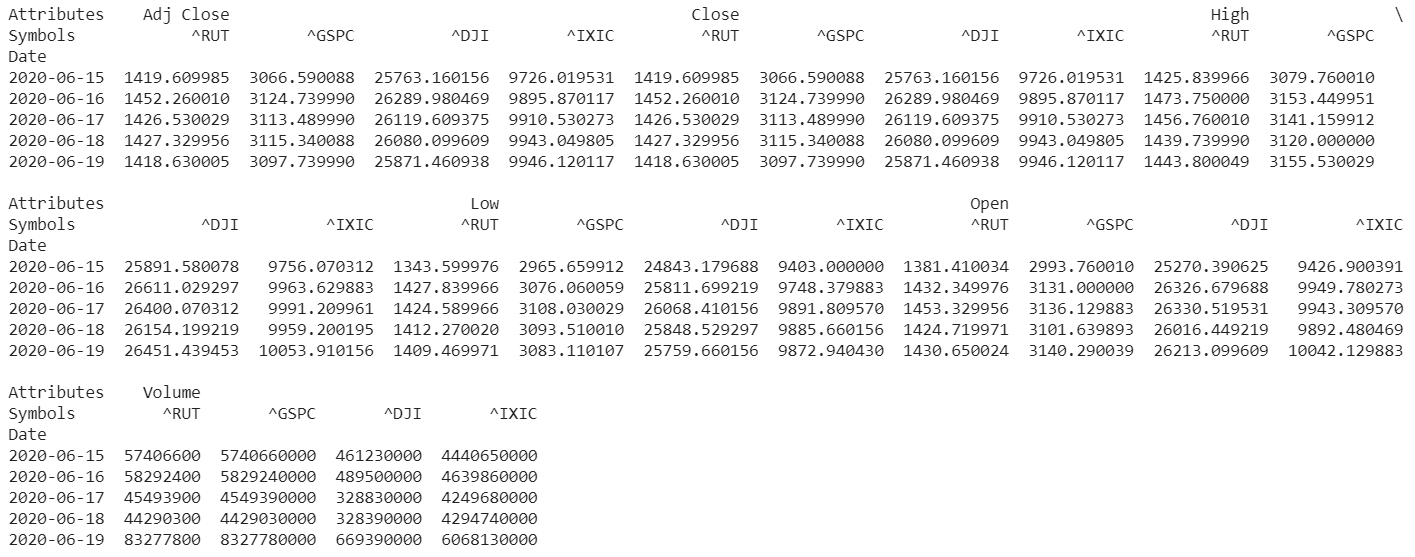
start = pd.to_datetime('1990-01-03')
df = web.DataReader(stock, data_source = 'yahoo', start = start )
Let us fit all the closing prices of the series in a neural network architecture and shall predict one series (NASDAQ composite price) from there.Train-test splitWe split into train-test and visualize the output.
data = df [['Close']]
data = data.reset_index()

training_data = data[data['Date'] < pd.to_datetime('2016-12-31')].copy()
test_data = data[data['Date'] >= pd.to_datetime("2016-12-31")].copy()
training_data = training_data.set_index('Date')
test_data = test_data.set_index('Date')
plt.figure(figsize=(14,4))
plt.plot(training_data.Close['^RUT'])
plt.plot(test_data.Close['^RUT'])
plt.ylabel("Price")
plt.xlabel("Date")
plt.legend(["Training Set", "Test Set"])
plt.title("Chicago Options Close Price")
plt.show()
Image for post](https://miro.medium.com/max/1133/1*VFcqWLy2ScRZSTWCRoU7mw.png)
Likewise, we can draw other plots in the series too.
#neural-networks #predictive-analytics #lstm