Hello everyone. I hope you are safe during these tough times. Coronavirus is spreading widely across all countries. Data analysis helps us to understands how Coronavirus is spreading all over the world. I am using three datasets (confirmed cases, recovered cases, deaths) for analysis. Datasets are available on the following link. https://data.humdata.org/dataset/novel-coronavirus-2019-ncov-cases. Data is taken from this website. It may not be accurate. Let’s begin.
Coronavirus dataset is from 22nd January and it gets updated each day. you can download the latest dataset from the above link and change the headers with new file names. First, let’s import all the libraries needed for analysis.
import numpy as np
	import pandas as pd
	import matplotlib.pyplot as plt
	import warnings
	warnings.filterwarnings("ignore")
Let’s to add datasets. I am reading all dataset at the beginning of the analysis so it helps everyone to easily change names and file path.
covid_confirmed = "time_series_covid19_confirmed_global.csv"
	covid_recovered = "time_series_covid19_recovered_global.csv"
	covid_death = "time_series_covid19_deaths_global.csv"

	covid_confirmed_dataset = pd.read_csv(covid_confirmed)
	covid_recovered_dataset = pd.read_csv(covid_recovered)
	covid_death_dataset = pd.read_csv(covid_death)
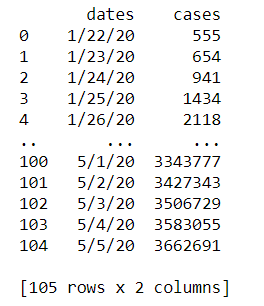
Let’s first look at confirmed cases dataset. I gives us overview of dataset which help us in analysis.
print(covid_confirmed_dataset)

Now, we will look each day confirmed cases and plot a graph to see how much it increased, and currently, it is increasing or flatten. “iloc” is basically for integer-location based indexing for selection by position. iloc[:,4:] means all rows and starting from 4th column to all columns.
total_cases = covid_confirmed_dataset.iloc[:,4:].sum(axis = 0, skipna = True).astype(int).reset_index()
	total_cases = total_cases.rename(columns={0 :'cases', 'index': 'dates'})
	dates = total_cases['dates']
	print(total_cases)

	plt.figure(figsize = (18,8))
	plt.plot(total_cases['dates'],total_cases['cases'])
	plt.ylabel("Number of confirmed cases")
	plt.xlabel("Date")
	plt.title("Confirmed cases on each day")
	plt.xticks(rotation= 90)
	plt.show()

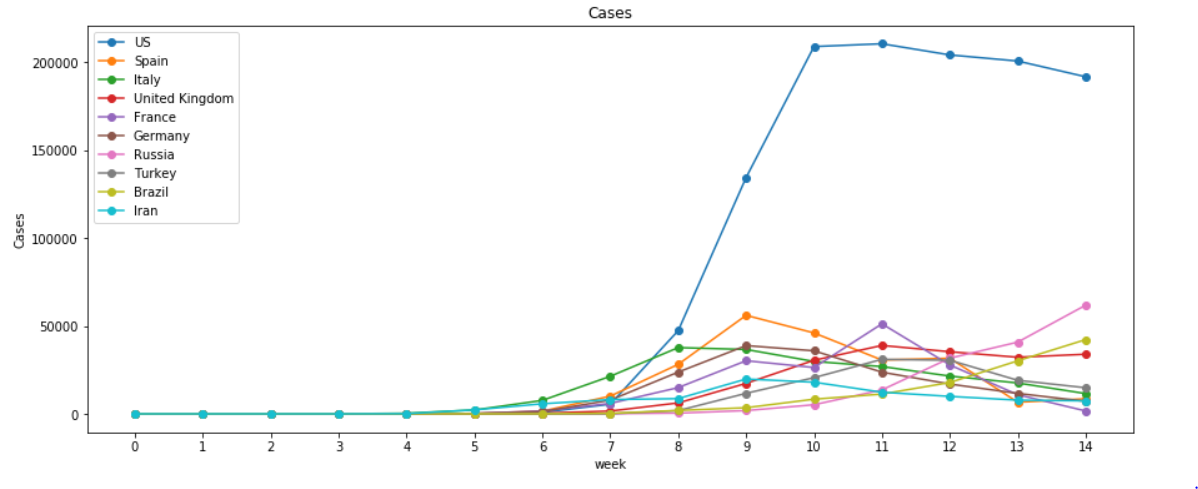
So, we can see that graph is increasing exponentially each day. Next, we are going to see how many total cases increased each week starting from the first day which is 22nd January 2020. To do that, we have to find every 7th-day data and create a table for that. “copy()” will create a copy of the dataset so it will not change to the original dataset.
#data-science #coronavirus #data-analytics #covid19 #data-analysis