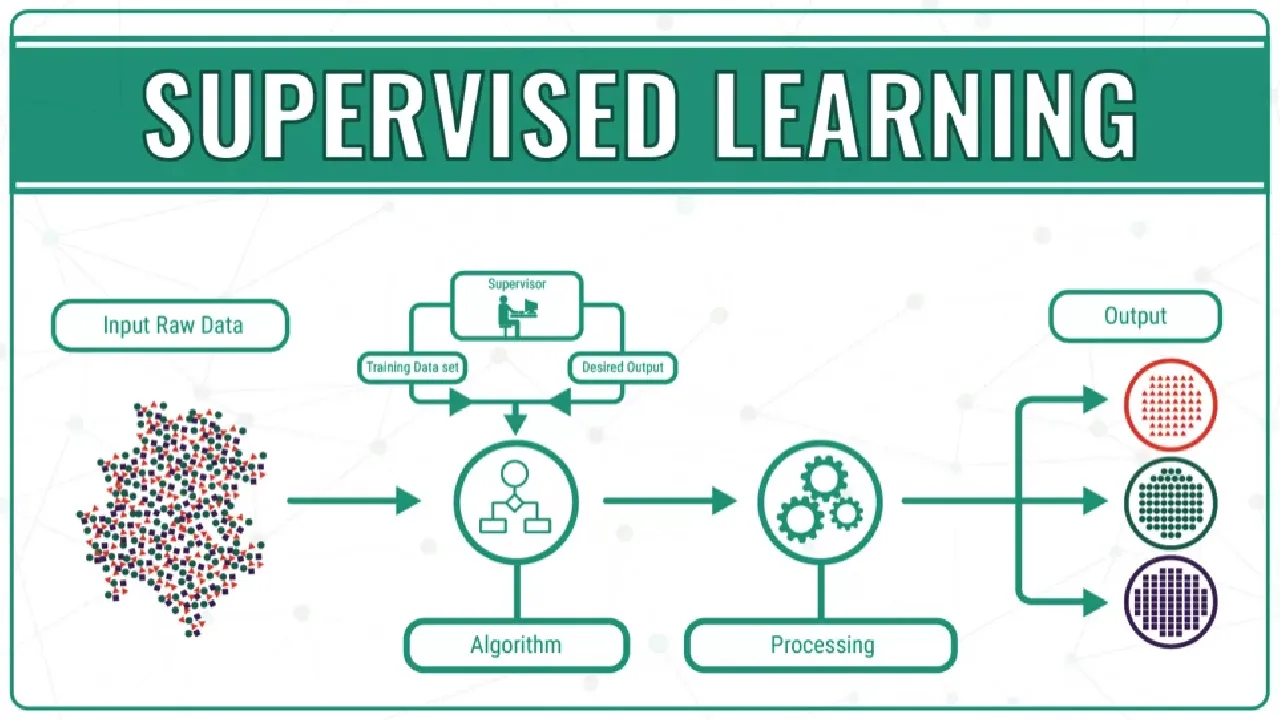
What is supervised learning?
The Supervised learning machine learning algorithms are done when our data is labeled. We have two types of supervised machine learning algorithms
- Regression.
- Classification.
1. Regression
It is explained in this blog: Click here
Hyperparameter tuning for Linear Regression: Click here
2. Classification
When will we use classification supervised learning?
Classification is the method used to predict the Categorical variable in the target column or dependent variable based on independent features. The output for the classification problem will be in binary class or multi-class. It falls under the supervised technique. It is a statistical tool used to find out the relationship between the outcome variable, the dependent variable, and one or more variables often called independent variables.
We have many algorithms under the classification
- Logistic Regression.
2. Decision Tree.
3. Random Forest.
4. KNN
5. Navie Baies.
6. Ada Boosting
7. XG Boost
8. Gradient Boost
These are the most frequent and popular algorithms for Machine learning under classification problem
Let’s discuss the simple and most popular algorithm under the classification problem.
1. LOGISTIC REGRESSION
This is because it is built on linear regression. Logistic regression is another popular AI algorithm able to provide binary results. This means that the model can both predict the outcome and specify one of the two classes of their value. The function is also based on changing the weights of the algorithms, but it differs since the non-linear logic function is used to transform the outcome. This function can be presented as an S-Shaped line (or) Sigmoid curve separating the true values from false ones.
The success requirements are the same as for linear regression- removing the same value input samples and reducing the quantity of noise (Low-value data). This is quite a sample function that can be mastered relatively fast and is great for performing binary classification. The objective of logistic regression is to minimize the errors utilizing Log Loss.
The logistic regression equation is derived from the straight-line equation.
Y=C+B1X1+ B2X2+…… + Bn*Xn
This ranges from -inf to +inf. But in logistic regression, we need to predict the values between 0 to 1 so we to transform Y.
If Y=0 then 0
If Y is 1-Y then Y=1 then infinity
Let us transform further to get range between -inf to +inf
Log(Y/1-Y) => Y=C+B1X1+ B2X2+…… + Bn*Xn
To make in the probability range from 0 to 1. We will use the sigmoid curve function.
Sigmoid curve
The sigmoid curve has all the properties you would want, extremely low values at the start, extremely high values at the end, and intermediate values in the middle, it’s a good choice for modeling the value of the probability of the event. If the estimated probability is greater than 50%, then the model predicts that the instance belongs to that class (called the positive class, labeled “1”), or else it predicts that it does not (i.e., it belongs to the negative class, labeled “0”). This makes it a binary classifier.
Sigmoid curve formula
Sigmoid curve
The red line cutting in the center is the** threshold line**
Log Loss
In logistic regression, the output can be the probability can be yes (or equals to 1). This probability is a value between 0 and 1. Log loss (Logarithmic loss) measures the performance of a classifier where the predicted output is a probability value between 0 and 1. If our model predictions are correct then our log loss will be 0 else greater than 0. Remember that, lower the log loss value higher the accuracy of our model.
#logistic-regression #machine-learning #supervised-learning