Automatic Analytics with Cube.js
A decade long in Quality Engineering and Test Automation and my observation have been that something that is generally missing when it comes to Test Automation is the visibility. Yes! You heard it right. The Visibility!
At times, I even got a feeling that Test Automation was becoming the responsibility of only the QAs when every member of the team is responsible for the Quality aspect. And the reason for that was as well missing Visibility of Test Automation at times. Since you don’t see what's going on day to day basis, you don’t hold yourself responsible for it. And at times, don’t see much of value in it as well. To an extent —
Out of Sight, Out of Mind.
One of the first and the foremost thing that the team practicing Agile believes in is Visibility. Visibility in the form of Story Walls, Barometer (To track overall sprint progress), Build Monitors, Burndown Charts, Ice-cream Meters (Who is attending Stand ups on time and who is not) is very common among the team practicing Agile.
Visibility of automation is not only important for Quality Analysts or Test automation engineers but for every member of the Scrum team i.e. BAs, Devs, UX Designers, Product Owners, Product Managers, and Business Stakeholders. Test automation metrics are direct indicators of the health of the product and hence hold a very high significance. Metrics help in making effective decisions.
The first Test Automation dashboard I had created was exactly a decade back using Jsps and MySql. Post that, I had been using Spring Boot, MySql, and UI framework from time to time. But, with the rise of Node.js and the mammoth rate at which the JS frameworks are coming up, this time I thought of exploring something beyond the traditional stack.
As I was exploring various options, something that grabbed my attention was Cube.js. I looked at some of the examples use cases on the Cube.js website. Looking at the live demos, I realized that this is what I was looking for. Had a quick glance at the documentation and found it to be neatly organized, detailed and up to mark. Joined the Slack channel to see how is the support and it was pretty good. Almost, all the queries answered with a decent turn around time. My personal experience — I asked two queries on the Slack channel and both were resolved within minutes.
So to be precise, what Cube.js needs from its user is a solid understanding of your database. And it does the heavy lifting in terms of wiring or chaining the components. A bit of plumbing gets the showup and running in a few hours if not minutes. In less than two days, I created this Test Automation Dashboard. Database that I have used is MySql. The database schema is as in the snapshot below.
Database Schema

testautomationresults database schema
Let us have a look at each of these tables -
- TbExecution — This table holds the details about the test automation execution. Every time, test automation execution is triggered, a new Execution entry is added in this table.
- TbFeature — This table holds the details of all the features in a particular product.
- TbTestplan — This table holds the details of the testplan in all the features. The relationship here is many to one i.e. one feature will have multiple testplans.
- TbTestcase — This table consists of all the testcases that belong to all the testplans. The relationship here is many to one i.e. one testplan will have multiple testcases.
- TbExecutionDetails — This is the table that holds the execution results of all automation runs. It has the execution status of every testcase in a testplan across features executed during a specific test automation execution.

testautomationresults database
One of the basic things about this entire set up of MySql and Cube.js is, it is Test automation framework agnostic. Meaning, irrespective of you using TestNG-Selenium or TestNG-RestAssured or Jasmine-Protractor or Mocha-SuperTest or any other framework of your choice, all you got to focus on is updating the MySql database post the end of the automation execution. As long as, the underlying language used for test automation is able to connect to the MySql database and update the results post-execution, desired charts/metric will be displayed by Cube.js.
Test automation framework & Cube.js

Test Automation Frameworks in different languages updating the results in MySql database
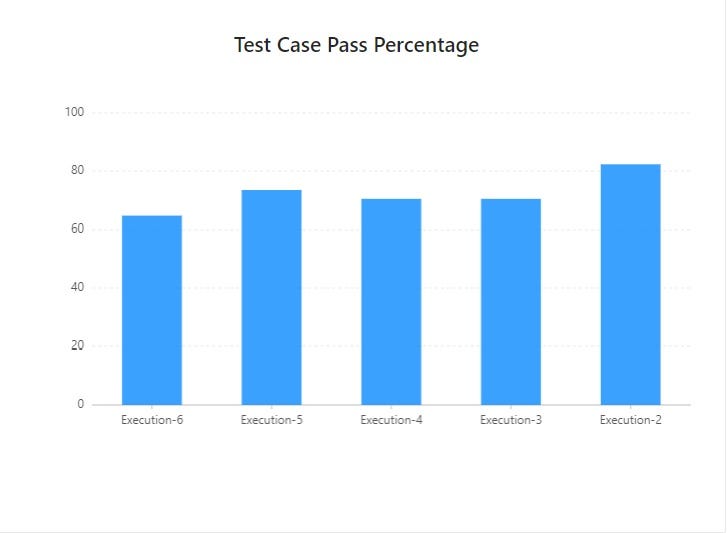
The goal behind creating this Test automation dashboard is to answer some of the questions regarding the overall test coverage. Questions like -
- In last 5 automation executions, what is the overall test case pass percentage?
2. In last 5 automation executions, what is the overall pass to fail test case count in the total test cases executed?

3. What are the total test cases executed, pass, fail and pass percentage for last 5 executions?

4. What are the total test cases executed, pass, fail in a Test plan in every Feature?
Now that, we have understood, what was the goal behind coming up with this dashboard, let us take a look at its folder structure. The database schema and the folder structure can be cloned from here. The folder structure is as in the snapshot below.
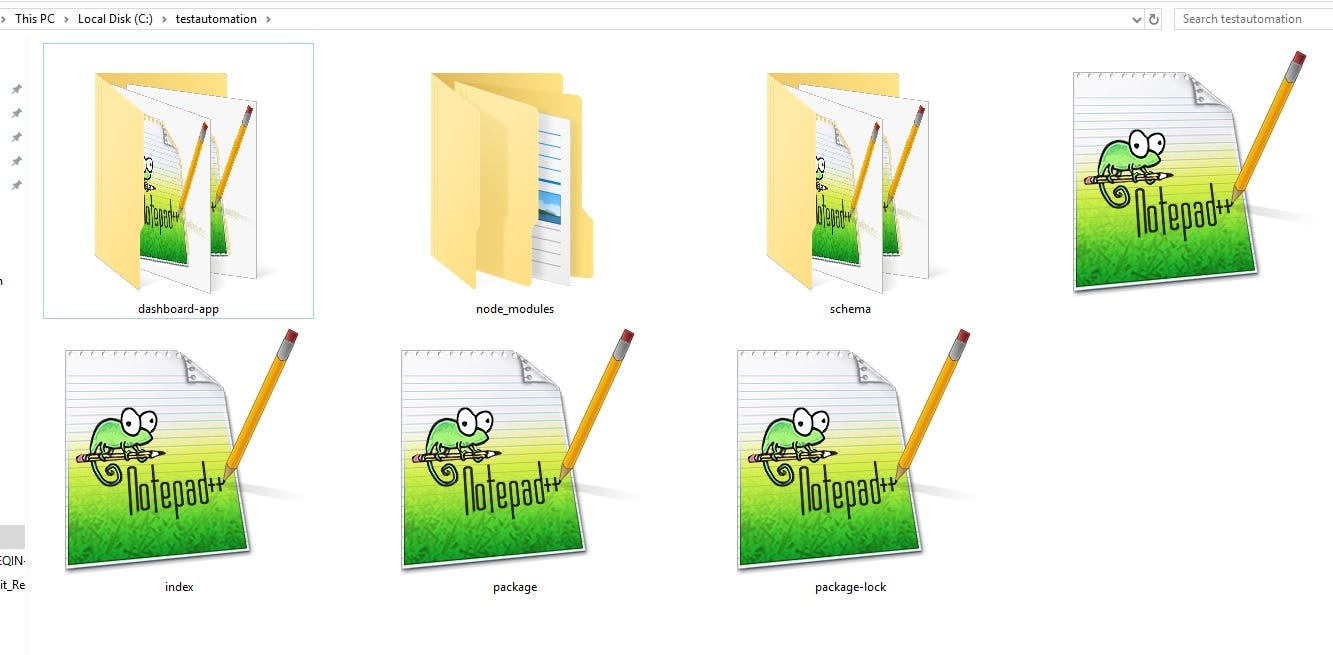
testautomation Cube.js folder structure
In the cloned git repository, the additional folder that you see — mysql-schema is the one that holds the MySql database schema. That is the sample test data along with the database schema that we will be using to generate the charts as in the snapshot above.
Pre-Requisites
- Node
- npm
- MySql
Steps by Step Guide
Step 1: Verify if Pre-Requisites are properly installed -
a. NodeJs & npm

b. MySql

Step 2: Set up the “testautomationresults” database using the “testautomationresults.sql” file from “mysql-schema” folder.
mysql -u root -pdrop database testautomationresults; create database testautomationresults; use testautomationresults; SOURCE C:\testautomationresults.sql

Step 3 : Git clone the repository using the command below
git clone https://github.com/Shreyasc27/testautomationdashboard-cubejs.git
Step 4 :
cd testautomationdashboard-cubejs
Edit the “.env” with appropriate MySql details

Step 5:
cd testautomationdashboard-cubejsnpm install npm run dev
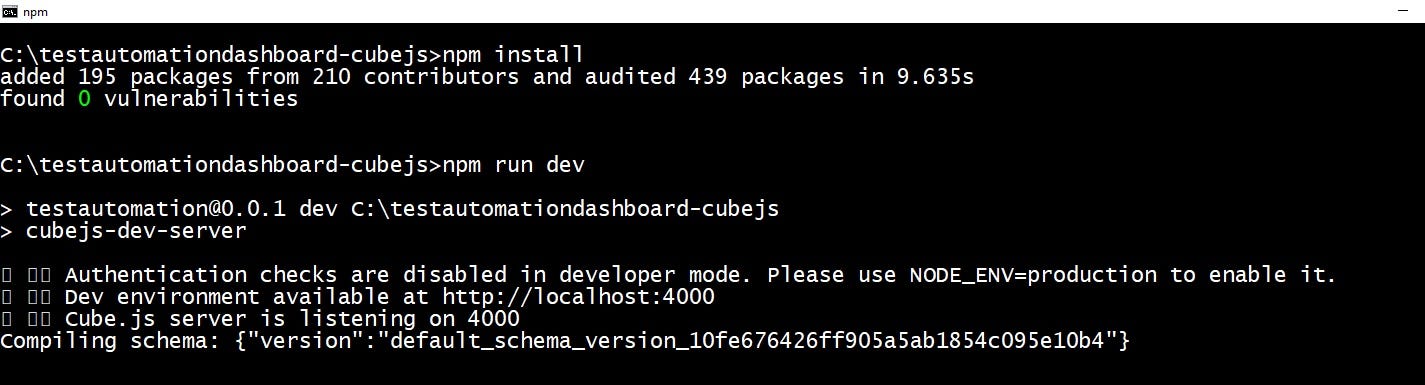
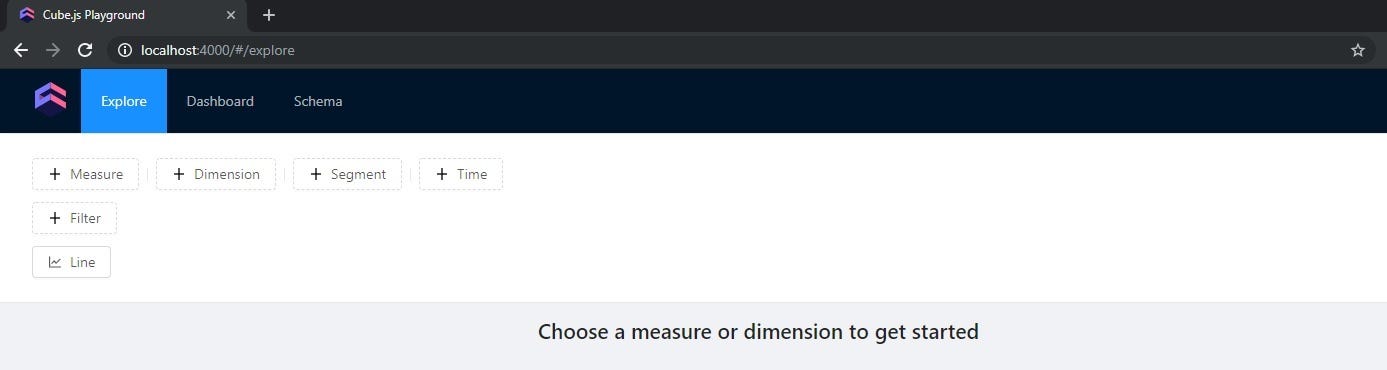
As in the cmd above, open url “http://localhost:4000”. Development environment as below will be displayed.
For further exploring this development environment, refer to the document on the Cube.js website.
Step 6:
cd testautomationdashboard-cubejs\dashboard-appnpm install npm run-script npm run-script build
Running above commands will generate a “build” folder in “dashboard-app”.

Step 7:
Copy the generated “build” folder to any other directory
cd buildnpm install http-server -g http-server
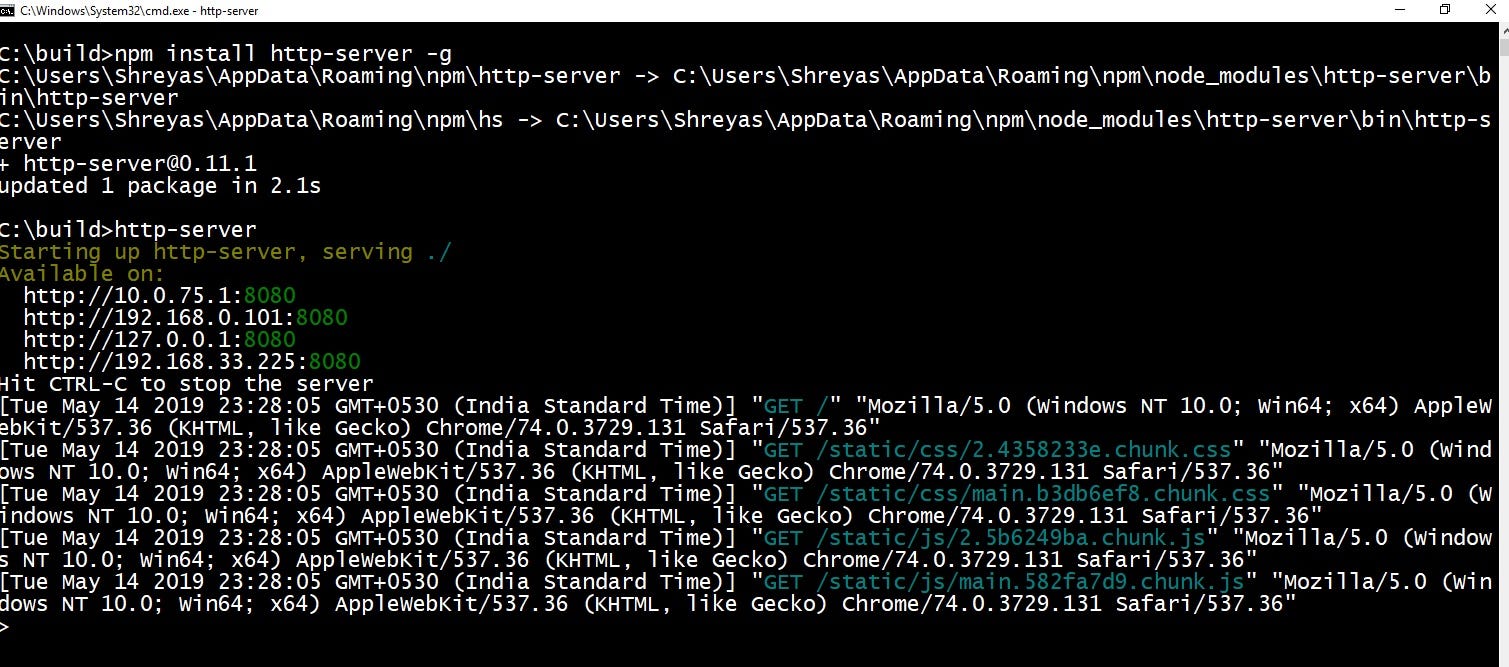
Step 8: Hit any of the urls listed. Test Automation Dashboard should be up and running.


Thank for reading!
#web-development