Note from Towards Data Science’s editors:_ While we allow independent authors to publish articles in accordance with our rules and guidelines, we do not endorse each author’s contribution. You should not rely on an author’s works without seeking professional advice. See our Reader Terms for details._
First of all, to say that today, predicting as such the exact market structure that will happen in X given time, is not possible, I’m sorry :( . This is due to factors that are unknown in advance, since the future price does not depend only on the past price, but also on macroeconomic changes and concrete business decisions.
Examples of this are the advanced recurrent neural networks (RNN) or the new LSTM, they are going to give us a late prediction, although at first sight they seem good, they will have a certain delay. However, we would have to approach the market with another strategy if we want to implement neural networks, but this will be in another article.
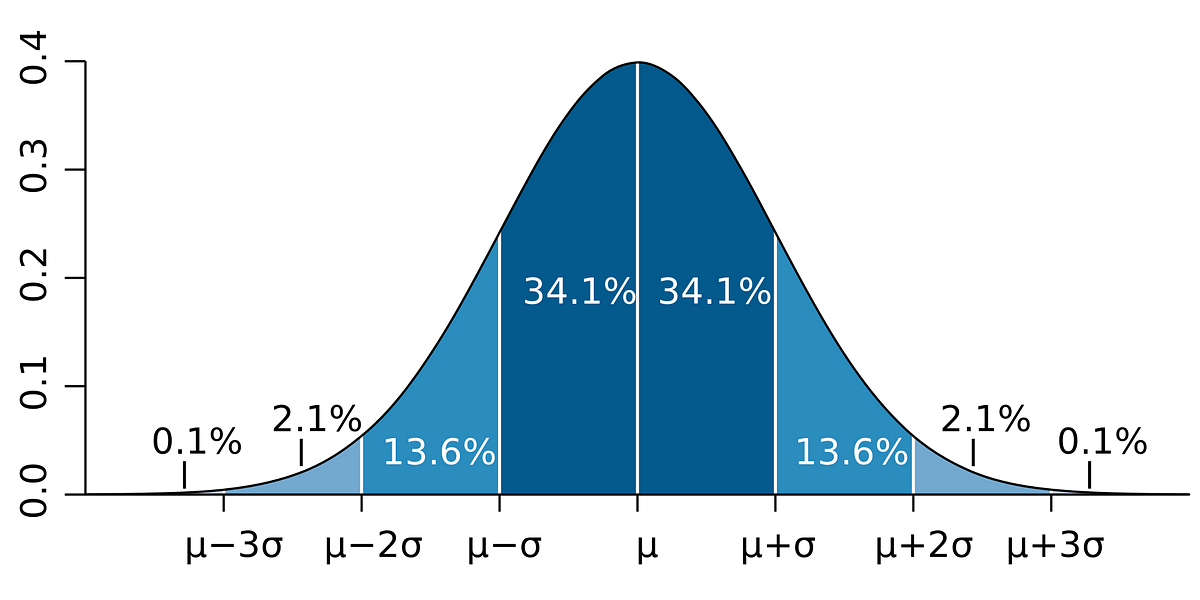
Normal Distribution
In this article we are interested in explaining how we can establish a maximum and minimum price for any asset (in this case we will work on American equities) with a certain probability.
I mean, if we apply an initial hypothesis about the market saying that the logarithmic returns of any asset can be represented as a Normal Distribution N(μ, σ²). We can then say that all market returns are represented by:
- A density function F(x):
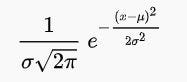
Written in Wolframalpha by the author
- A distribution function E(x):
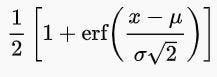
Written in Wolframalpha by the author
That will give us the tool to constitute the famous Gaussian bell represented by a probability distribution around the mean in a distribution N(μ, σ²).
#quantitative-finance #data-science #finance #stock-market #equity