A study analyzing the stock price behaviour at the time when US companies file their earnings with the SEC

Purchasing the right stocks at the right time is fundamental to successful investing. As a Data Scientist, I believe in finding patterns in data, which in the field of investment can be quite profitable. In this article, I will explore the pattern of “good news about the company trigger the stock price growth” and share my observations with you.
Opportunity
Many of us who look at the charts might have noticed that the release of financial statements have an immediate impact on the stock price. Below is an example borrowed from www.vhinny.com on how KHC stock reacted to the release of the company’s quarterly 10-Q report.

You can see this pattern of immediate price change (drop or increase) for almost any stock just after the company releases its business performance. Looking at such behaviour, two questions might come across an investor’s mind. First, is there a way to anticipate the direction of the price move before it occurs? Second, once the move has occurred, will the stock continue moving in a predictable direction?While some investors may find the first challenge attractive and see an opportunity in anticipating the price move, I’ll take a side of the greats lead by **Warren Buffet, **arguably the greatest investor of all time, and simply say: “I don’t know how to do it”. In order for the stock price to move up immediately when a financial statement is released, not only does it have to outperform the company’s past earnings, it has to outperform analysts expectations of the current earnings. Predicting either of these two events is a challenge that, I beleive, a retail investor cannot address due to the lack of reliable information. Hence, it might be worth to avoid attempting this challenge all together.The **second **challenge of anticipating stock price evolution once the change has occurred is, on the other hand, a challenge an ordinary investor can address with the tools he or she has. In this article, I will explore whether the release of the annual financial statement (10-K) contains actionable signal that investors may use to decide whether there is an opportunity to make profit upon purchase.
Resources
To conduct this study, I’ve used financial data containing dates of 10-K releases from www.vhinny.com and stock prices from www.alphavantage.co. You can find the full reference code to analysis discussed in this article on my GitHub page.
Problem Statement and Scope
Objective: In this study, I will investigate whether there is an opportunity to make an investment decision once a financial statement has been released and the market has made its initial move in response to it.**Clarification: **Many financial statements are released during market closure. In the KHC example (see the chart above), markets closed on February 12, 2020 at $30, the financial statement (10-Q) was released in the after hours and markets opened on February 13, pricing KHC down 10% at $27 by the end of day. In this study, the question is not whether the price will drop 10%. It is rather the following. Once the price has dropped 10%, is there evidence that it will go further?**Dataset: **The dataset used in this study consists of 479 companies covered by the S&P 500 index, representing 11 industry sectors evaluated from January 2018 to December 2019 (2 years).Methodology: To generate this dataset, I first identified all (company, date) pairs for the financial statements released during the investigated period. For every unique date of a financial statement release, I’ve added (company, date) pairs of companies that did not have their financial statements released on that date. To keep the dataset size manageable, the latter company pairs were created for companies that operate in the same industry sectors as the ones that had their financial statements released. For example, if on February 19, 2020 only company A (Information Technology) and company B (Health Care) released their statements (positive examples), companies from the same two sectors only (Information Technology and Health Care) will be introduced for that date (negative examples). All available (company, date) pairs were inflated to cover the period between “date” and “date + 7 days” to provide visibility into the stock price behaviour.**Illustration: **Below I show an example of a company that released its financial statement (filing_date) on 2018–01–22. The stock price is tracked for the following 7 calendar days (n_calendar), which is generally equivalent to 5 trading days (n_trading). I’ve also included the stock price as of ‘filing_date’ under the ‘close’ column, stock price at ‘date’ in the ‘close_next_n’ column, and ‘percent_growth’ which represents percent change between ‘close’ and ‘close_next_n’. Column ‘filing_released’ is a flag indicating whether this company did release a financial statement on the ‘filing_date’. If ‘filing_released’ is 0, it means that this company did not release it’s financial statement and is used for comparison to some other company that did.
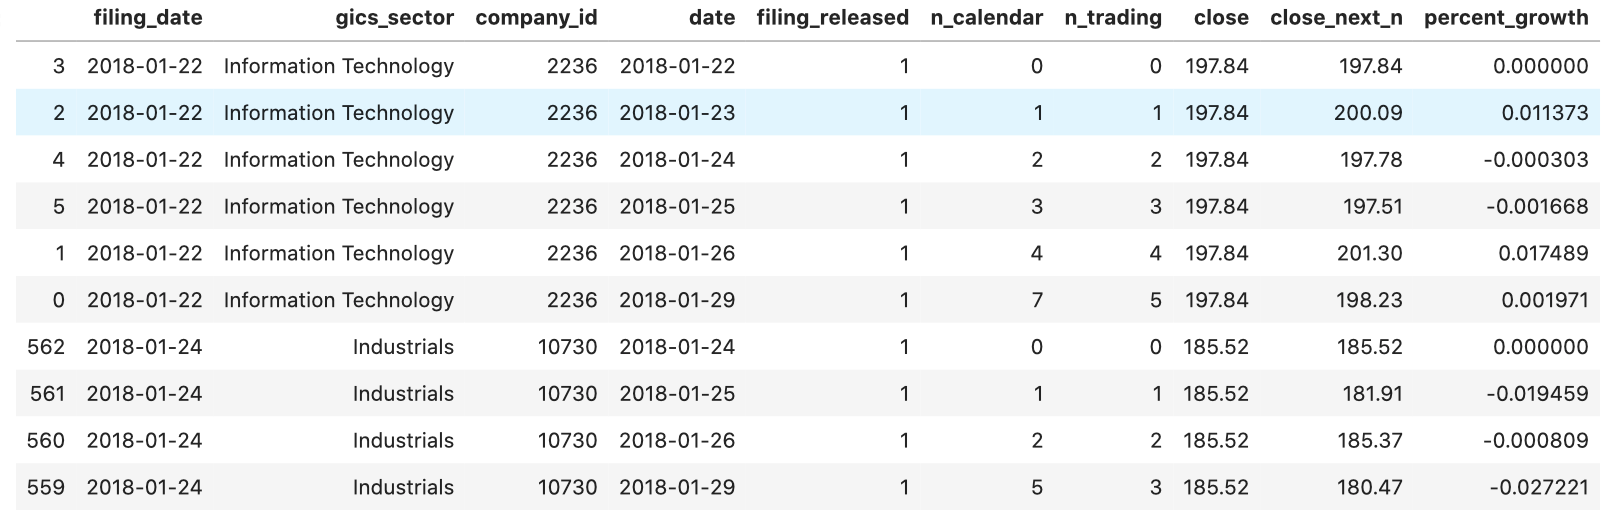
Note how company_id=2236 has gone from $197.84 to $200.09 on date=2018–01–23 after its financial statement was released on filing_date=2018–01–22
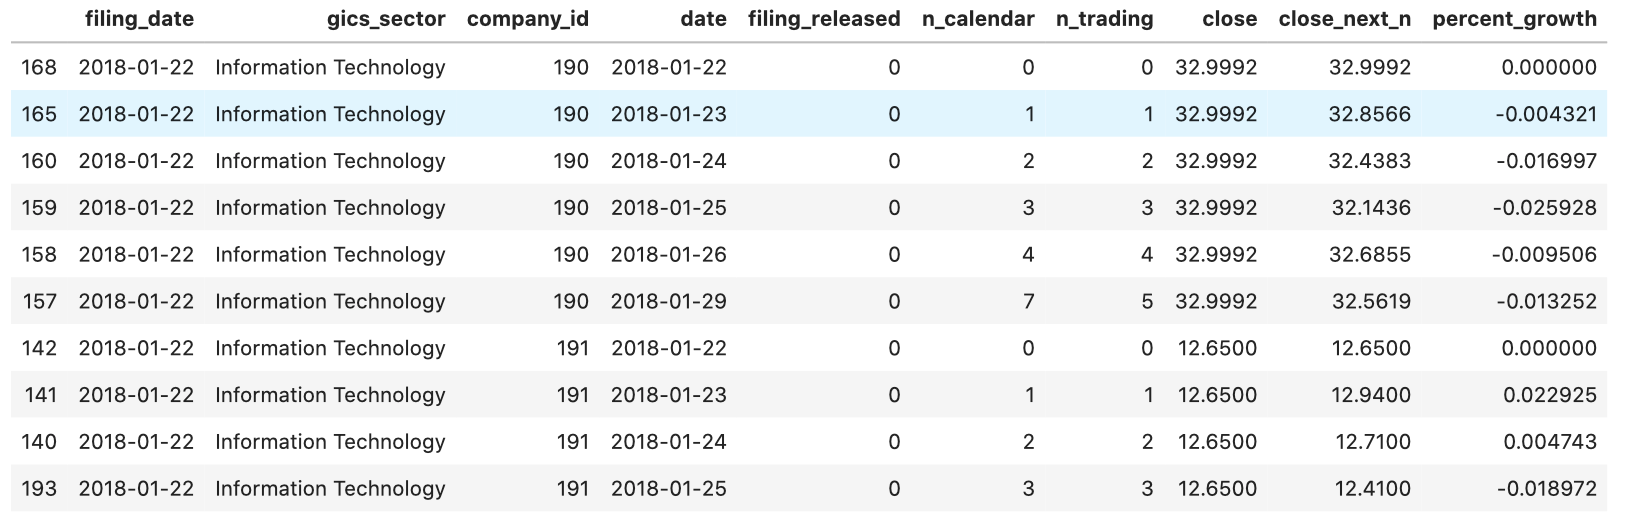
Note that this company (190) is presented as of the same filing_date=2018–01–22 and it did not release its filing (filing_released=0). It also did not show any tangible price change throughout the same 7 days.
**Evaluation: **I want to evaluate whether the release of a “good news” financial statement has an actionable impact on the stock price. To do this, I will compare the stock price growth of companies that released their earnings reports (positive examples) with companies that did not release their earnings reports (negative examples). It is important to introduce negative examples and perform comparative analysis instead of looking at the absolute growth numbers to eliminate the effect of market trends. For example, if a company belongs to a “down-trending” industry, a positive earnings report might stop the stock price from dropping rather than show a positive trend. Looking at the absolute performance, we would conclude that the financial statement for this company had no impact while comparing with other companies in the same industry would show above the average performance.
#stocks #investing #ai #machine-learning #vhinny