Let’s take a Vue application scaffolded with Vue CLI like this bahmutov/vue-calculator app. In this blog post, I will show how to instrument the application’s source code to collect the code coverage information. We then will use the code coverage reports to guide the end-to-end test writing.
The application
The example application can be found in bahmutov/vue-calculator repo that was forked from kylbutlr/vue-calculator which used Vue CLI default template during scaffolding. The code is transformed using the following babel.config.js file:
// babel.config.js
module.exports = {
  presets: [
    '@vue/app'
  ]
}
When we start the application with npm run serve, we execute the NPM script
{
  "scripts": {
    "serve": "vue-cli-service serve"
  }
}
The application runs at port 8080 by default.
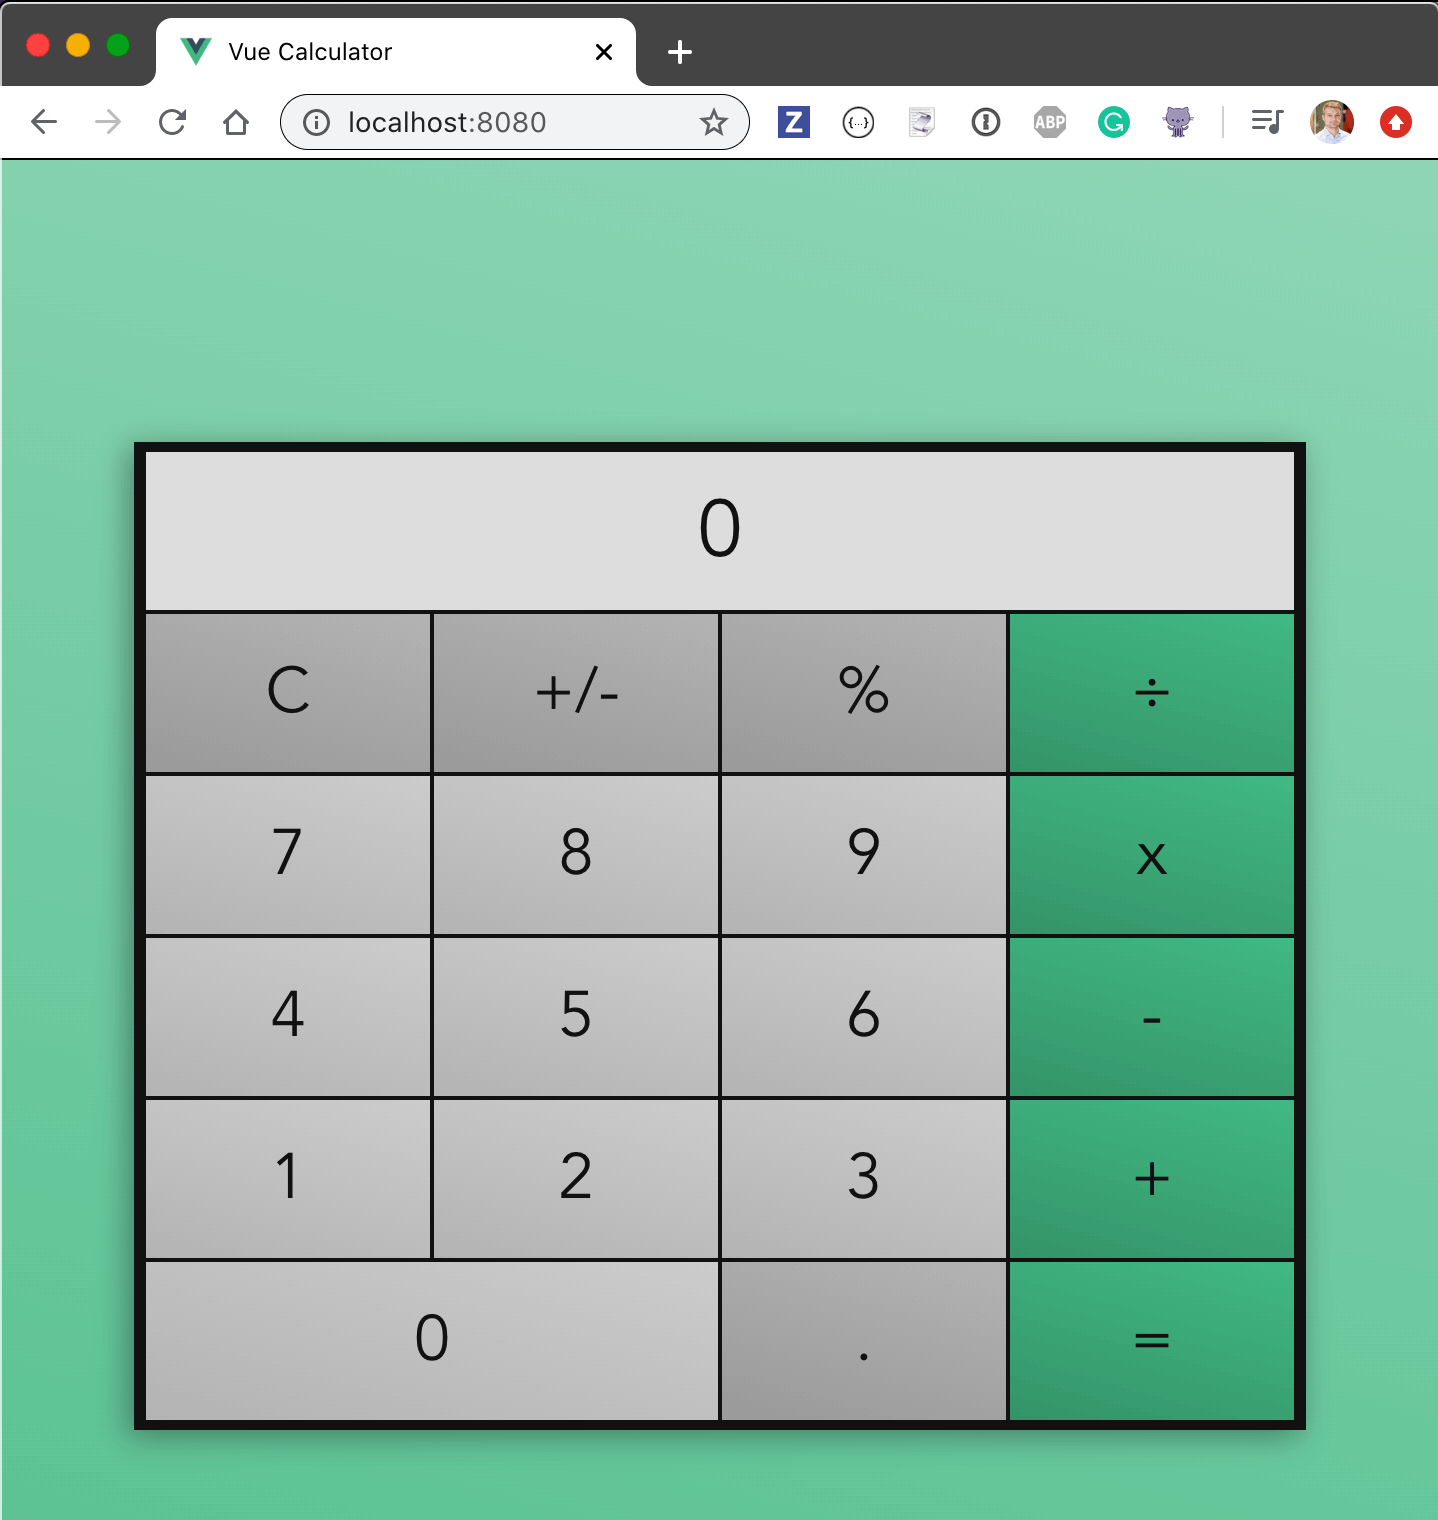
Tada! You can calculate anything you want.
Instrument source code
We can instrument the application code by adding the plugins list to the exported Babel config.The plugins should include the babel-plugin-istanbul.
// babel.config.js
module.exports = {
  presets: [
    '@vue/app'
  ],
  plugins: [
    'babel-plugin-istanbul'
  ]
}
The application runs, and now we should find the window.__coverage__ object with counters for every statement, every function, and every branch of every file.
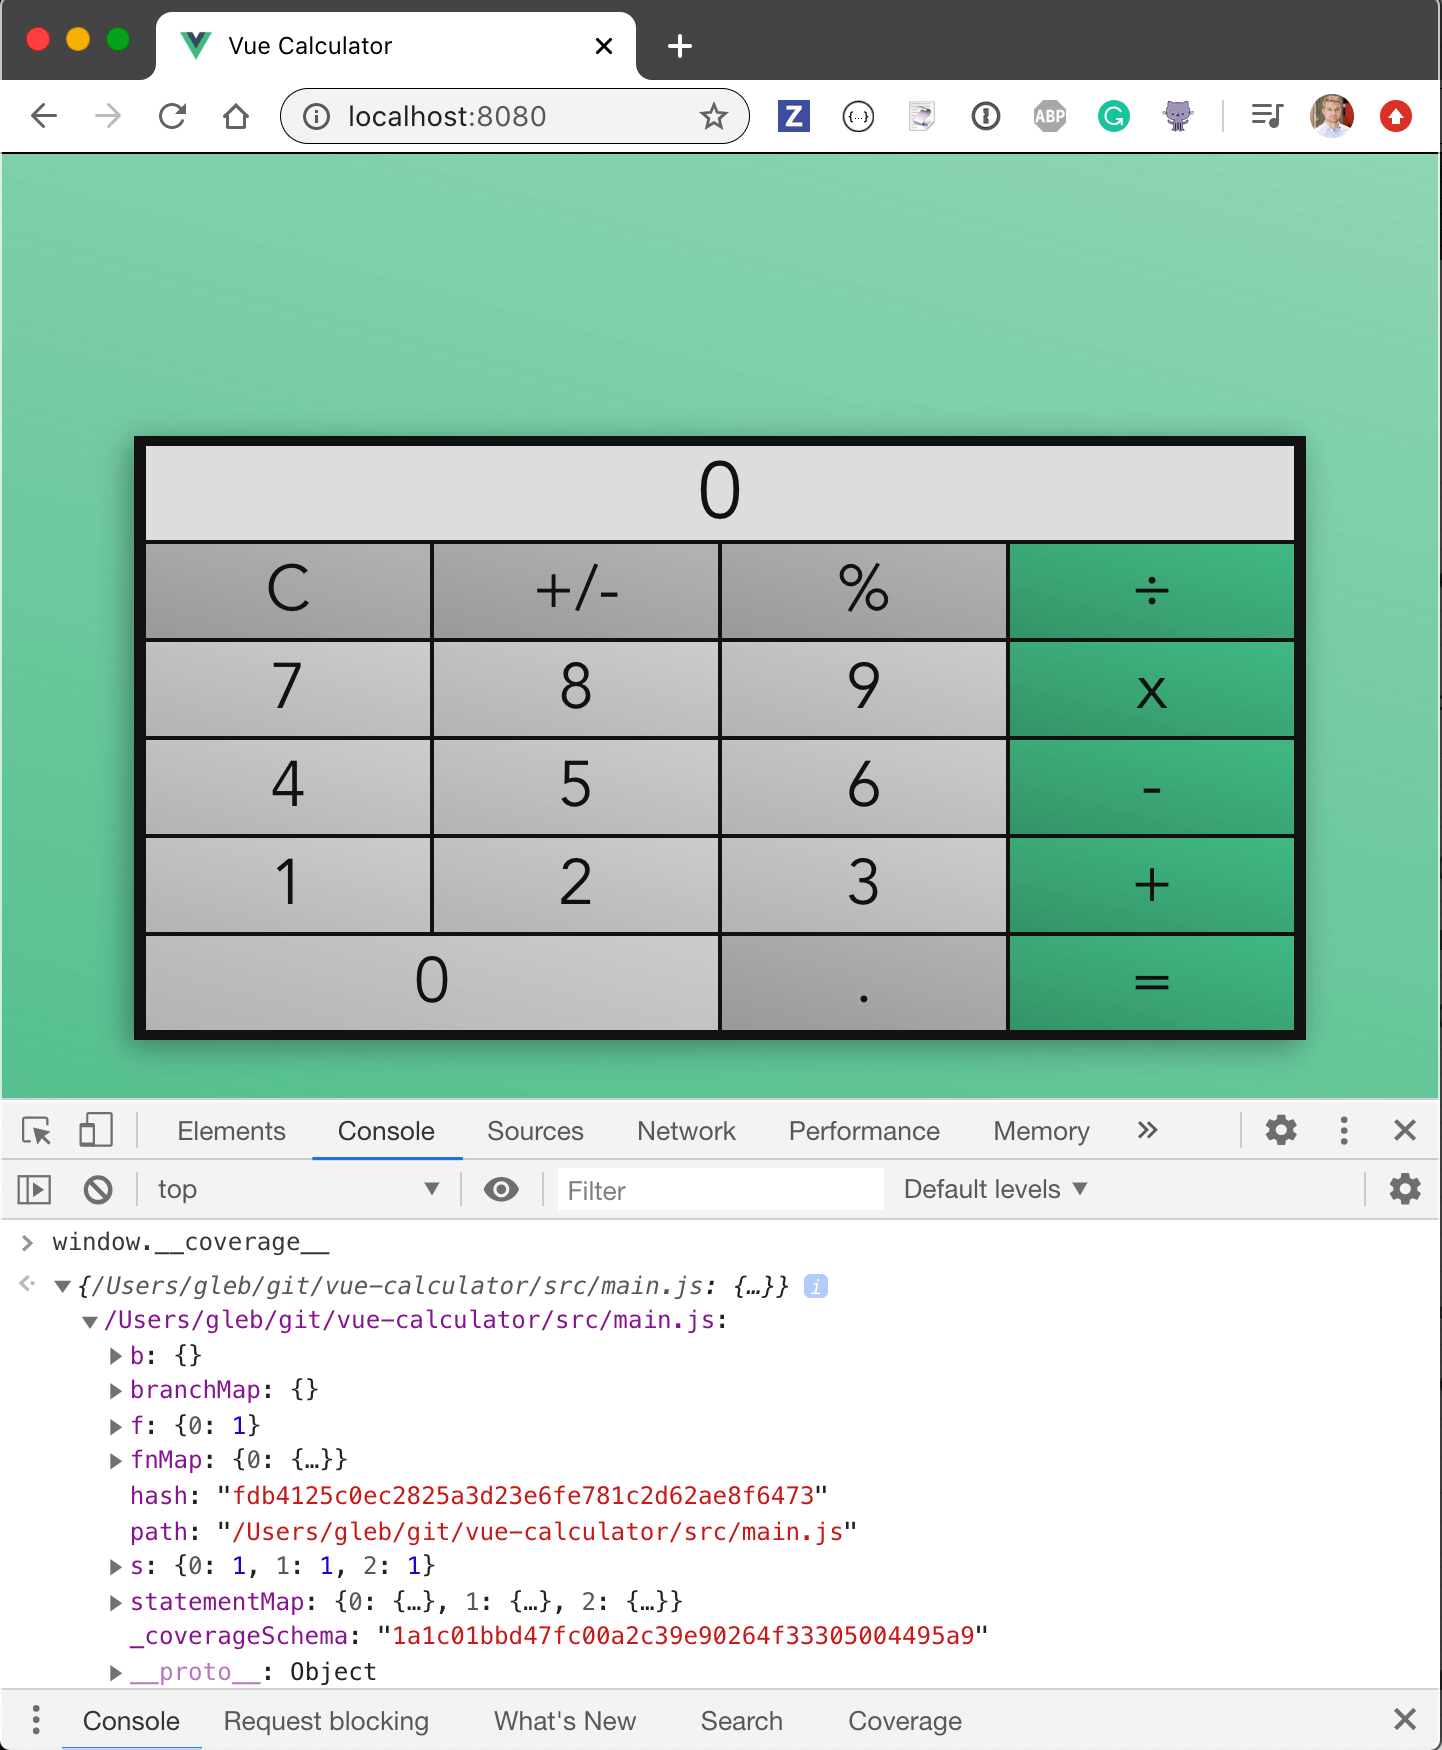
Except the coverage object as shown above, includes only a single entry src/main.js, and the coverage object is missing both src/App.vue and src/components/Calculator.vue files.
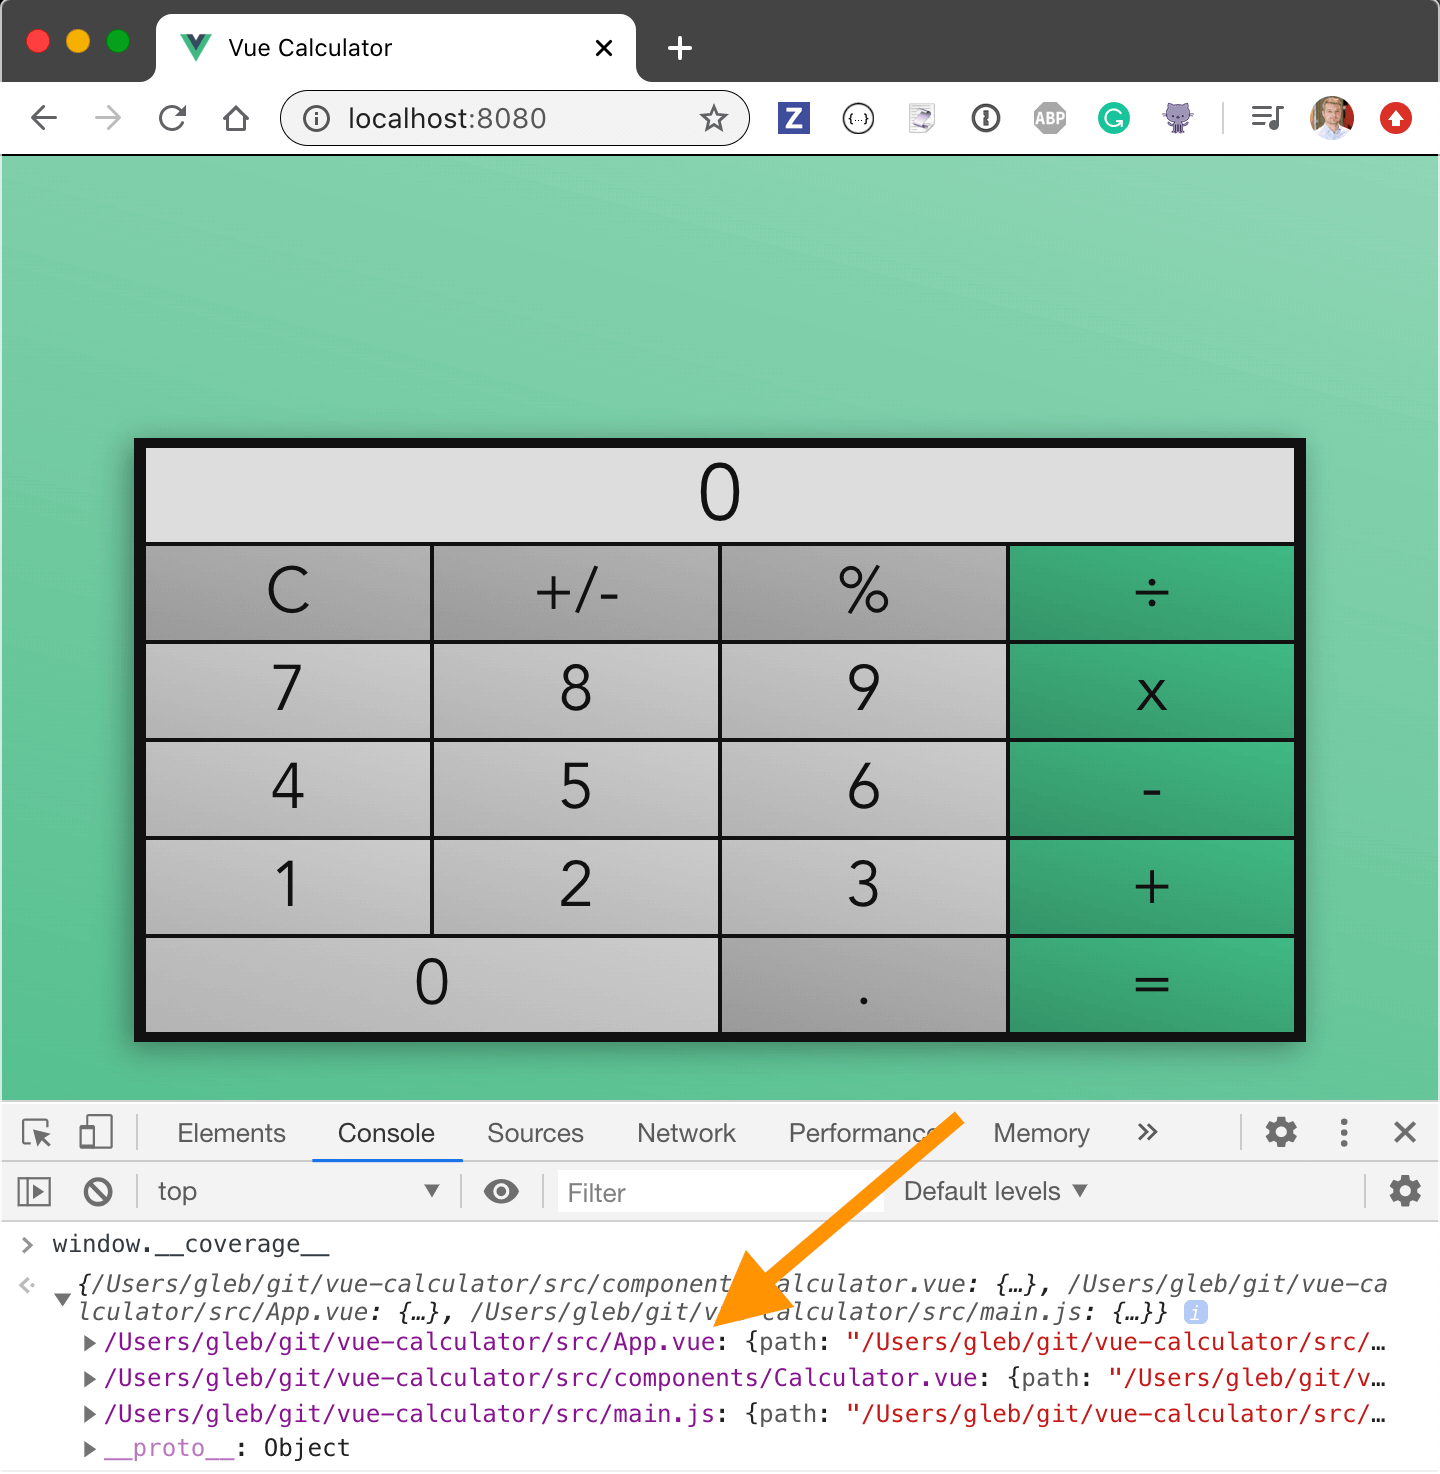
Let’s tell babel-plugin-istanbul that we want to instrument both .js and .vue files.
// babel.config.js
module.exports = {
  presets: [
    '@vue/app'
  ],
  plugins: [
    ['babel-plugin-istanbul', {
      extension: ['.js', '.vue']
    }]
  ]
}
Tip: we can place istanbul settings in a separate file .nycrc, or add them to package.json. For now, let’s just keep these settings together with the plugin itself.
When we restart the application, we get a new window.__coverage__ object with entries for .js and for .vue files.
#vue.js #testing #e2e #vue